How to Construct Automated Knowledge Graph using LLMs
Introduction
In today’s world, managing and using data well is really important. Automated knowledge graph, made with Large Language Models (LLMs), are changing how we organize and use large amounts of data. This blog post will explain how LLMs make building knowledge graphs better, talk about their benefits, and give you a clear guide on how to use these techniques.
The Evolution of Knowledge Graphs
Knowledge graphs have been around for a long time, but their use has changed a lot. They were first used in academic research to show complex relationships in data. Now, they are important in many industries. For example, Google’s Knowledge Graph helps make search results better by understanding how different things are related.
For instance, when you search for “Apple,” Google’s Knowledge Graph doesn’t just show information about the fruit. It also gives details about the technology company, like its CEO, products, and recent news.
The Rise of LLMs
Large Language Models (LLMs) are a big step forward in how computers handle language. Trained on large amounts of data, these models can create text that sounds like it was written by a person, understand context, and find connections between different pieces of information. Models like OpenAI’s GPT series and Google’s BERT have changed the way we work with text.
For example, GPT-3 can write essays, come up with creative ideas, and even create code from text prompts. Its ability to understand and produce human-like text makes it a useful tool for automating tasks, such as building knowledge graphs.
What is a Knowledge Graph?
A knowledge graph is like a map of information. It shows different pieces of knowledge and how they are connected.
Imagine you have a bunch of information about people, places, and things. A knowledge graph takes all this information and organizes it into a clear structure. For example, it can show that “Steve Jobs” is connected to “Apple” and “iPhone,” and “iPhone” is connected to “smartphone.”
By putting all this information together in a structured way, a knowledge graph makes it easier to ask questions and find answers. It helps you see how different pieces of information relate to each other, making it simpler to understand and analyze the data.
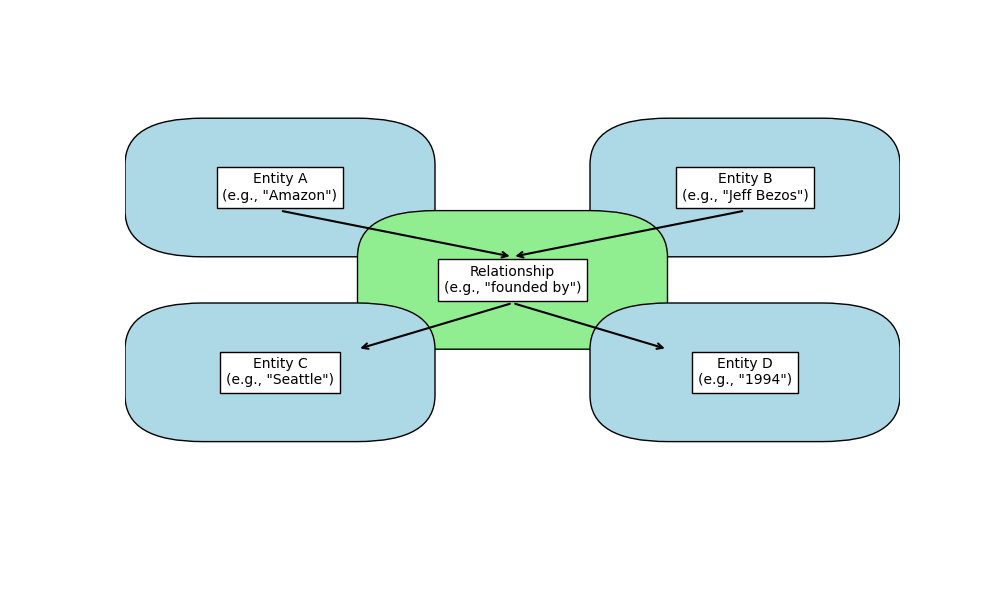
Explanation of the Diagram
- Entities: Represented as nodes or boxes in the diagram. These are things, concepts, or objects. For example:
- Entity A: “Amazon”
- Entity B: “Jeff Bezos”
- Entity C: “Seattle”
- Entity D: “1994”
- Relationships: Represented as edges or lines connecting entities. These describe how entities are related. For example:
- “founded by”: Connects “Amazon” to “Jeff Bezos”
- “headquartered in”: Connects “Amazon” to “Seattle”
- “founded in”: Connects “Amazon” to “1994”
Components of a Knowledge Graph
- Nodes: Represent entities or concepts. Each node typically corresponds to a distinct object, such as a person, place, or product.
- Edges: Represent the relationships or connections between nodes. Edges describe how entities are related to each other.
- Attributes: Additional information about each node that describes its properties or characteristics.
- Labels: Tags or types assigned to nodes and edges to categorize them.
Detailed Diagram of a Knowledge Graph
Here’s a detailed diagram and explanation of a knowledge graph
Examples of Knowledge Graphs
Here are some examples of knowledge graphs and how they are used:
- Corporate Knowledge Graphs: Companies use these graphs to organize information about their business. They map out their employees, products, and how different parts of the business are connected. For example, a corporate knowledge graph might show who works in each department, what products the company sells, and how different products are related.
- Healthcare Knowledge Graphs: These graphs help in managing and understanding medical information. They can show how patient data, medical conditions, and treatments are connected. For example, a healthcare knowledge graph might link a patient’s medical history with their current treatments and suggest better care options based on this information.
- Academic Knowledge Graphs: These graphs are used in the academic world to connect research papers, authors, and universities. They help researchers find relevant studies and understand how different pieces of research are related. For example, an academic knowledge graph might show how a research paper by a certain author is linked to other papers on the same topic or how different universities are involved in similar research areas.
Each type of knowledge graph helps organize information in a way that makes it easier to understand and use.
How LLMs Help Build Knowledge Graph
Understanding Large Language Models (LLMs)
Large Language Models (LLMs) are advanced AI tools that use deep learning to work with text. They are trained on lots of different types of text data and can do many things related to language, like writing text, translating between languages, and summarizing information.
How LLMs Help Build Knowledge Graphs
LLMs make it easier to create knowledge graphs by automating the process of finding and connecting pieces of information from text. Here’s how they do it:
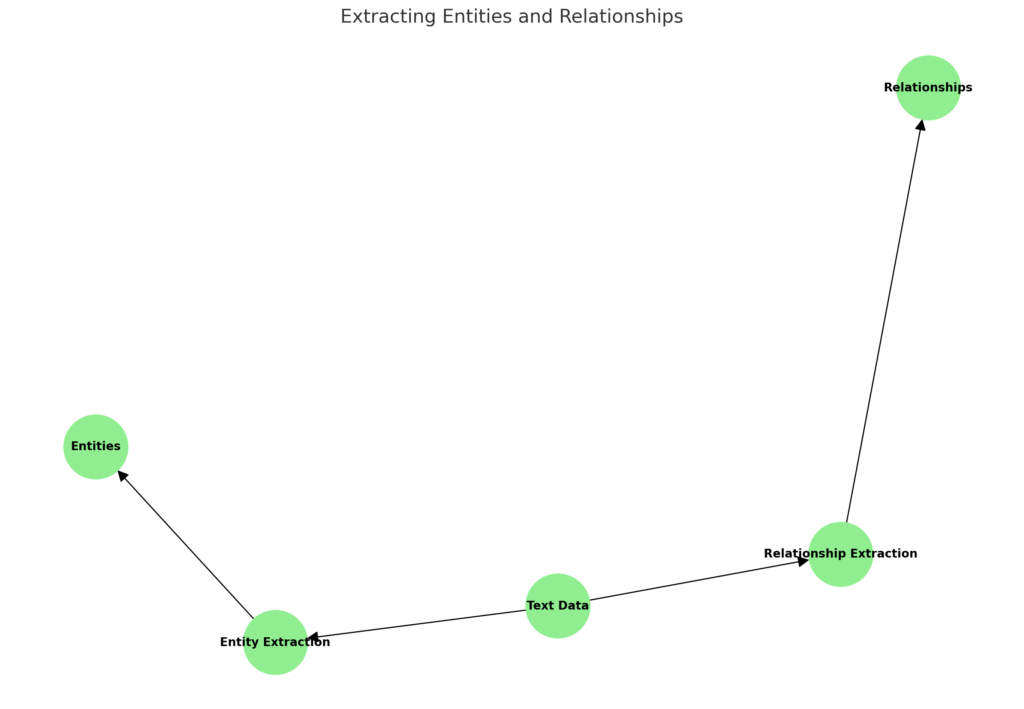
1. Extracting Entities and Relationships
Process:
- Text Processing: LLMs analyze vast amounts of text data to identify entities (e.g., names of people, organizations, locations) and their relationships.
- Named Entity Recognition (NER): The model identifies specific entities within the text.
- Relation Extraction: The model determines how these entities are related to each other based on context.
Example: From the sentence “Steve Jobs founded Apple Inc.,” an LLM would extract:
- Entity 1: Steve Jobs
- Entity 2: Apple Inc.
- Relationship: Founded
Diagram:
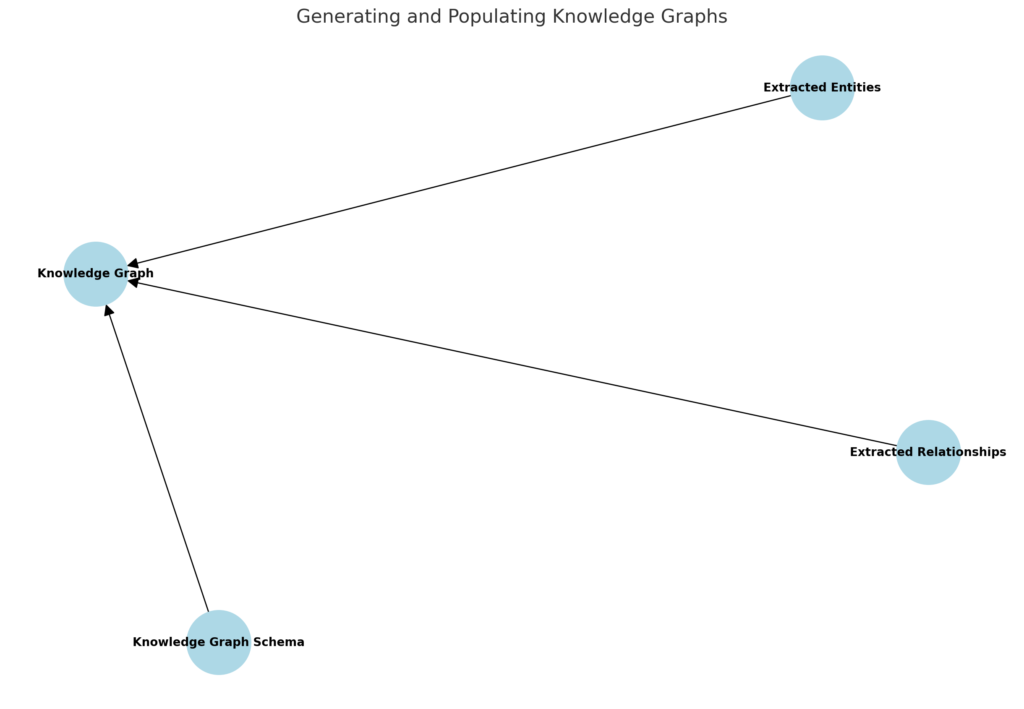
2. Generating and Populating Knowledge Graphs
Process:
- Graph Construction: LLMs assist in constructing nodes (entities) and edges (relationships) based on the extracted information.
- Graph Expansion: LLMs can generate additional nodes and relationships by predicting missing information or suggesting new connections based on context.
- Graph Integration: The generated knowledge is integrated into existing knowledge graphs, ensuring that the new information fits well with the current data.
Example: For a knowledge graph, the LLM would create nodes for “Steve Jobs” and “Apple Inc.” and an edge labeled “founded” connecting these nodes.
Diagram:
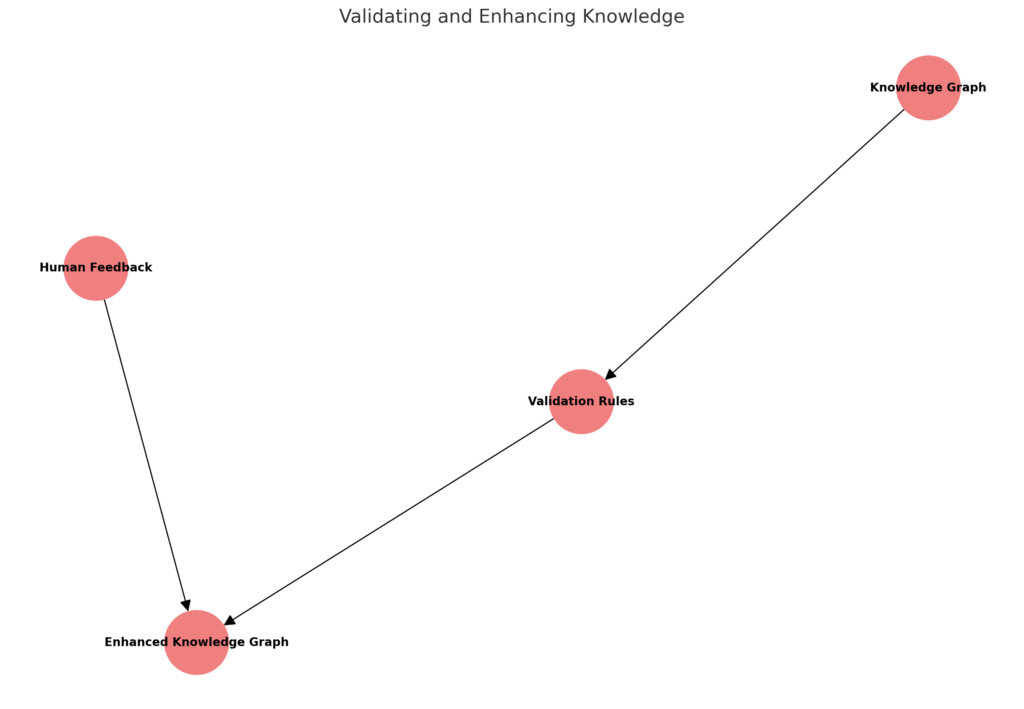
Validating and Enhancing KnowledgeProcess
LLMs can check for inconsistencies or errors in the knowledge graph by analyzing the relationships and entities.
Contextual Enhancement: They can enhance the graph by providing additional context or refining existing connections based on new data or insights.
Example: If the knowledge graph already includes a node for “Apple Inc.” and the LLM detects a new fact about its acquisition of another company, it can update the graph to reflect this new relationship.
These steps help in creating a dynamic and comprehensive representation of knowledge that can be used for various applications like search engines, recommendation systems, and more. Next let’s explore how to explore knowledge in graph.
Must Read
- How to Reverse a String in Python: Performance, Memory, and the Tokenizer Trap
- How to Check Palindrome in Python: 5 Efficient Methods (2026 Guide)
- Mastering Python Regex (Regular Expressions): A Step-by-Step Guide
- Python Optimization Guide: How to Write Faster, Smarter Code
- The Future of Business Intelligence: How AI Is Reshaping Data-Driven Decision Making
How to Visualize Knowledge Using Graphs?
Visualizing knowledge in a graph involves creating a visual and structured representation of information where entities and their relationships are mapped out in a way that is easy to understand and query. Here’s a detailed guide on how to represent knowledge in a graph:
1. Define the Entities
Entities are the key objects or concepts in your domain of knowledge. Each entity represents a distinct object, concept, or piece of information.
Examples:
- People (e.g., Steve Jobs)
- Organizations (e.g., Apple Inc.)
- Locations (e.g., Cupertino)
- Products (e.g., iPhone)
2. Identify the Relationships
Relationships describe how entities are connected or related to one another. Relationships are usually represented as edges between nodes in the graph.
Examples:
- “founded” (Steve Jobs → Apple Inc.)
- “located in” (Apple Inc. → Cupertino)
- “produces” (Apple Inc. → iPhone)
Diagram:
Steve Jobs --founded--> Apple Inc.
Apple Inc. --located in--> Cupertino
Apple Inc. --produces--> iPhone
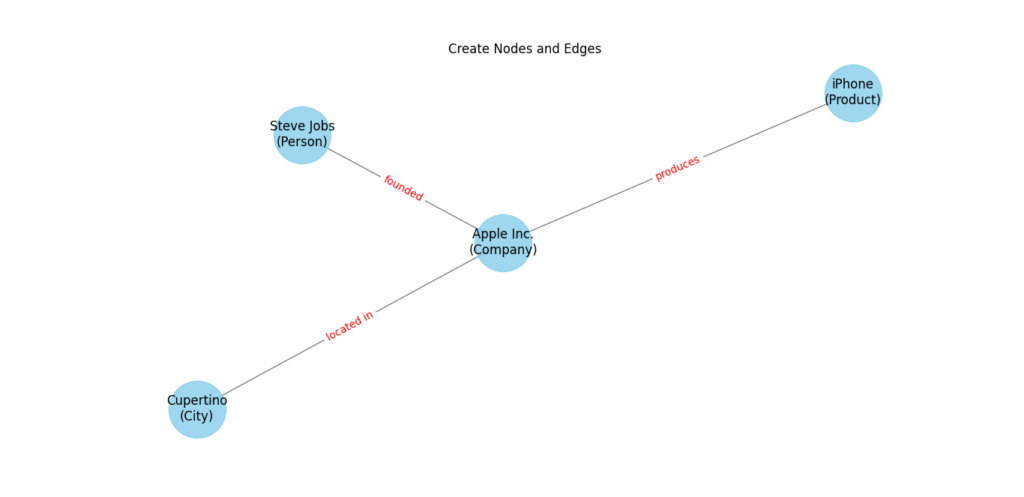
3. Create Nodes and Edges
Nodes represent entities, and edges represent the relationships between these entities. Each node typically has attributes that describe the entity.
Nodes:
- Steve Jobs
- Apple Inc.
- Cupertino
- iPhone
Edges:
- founded (between Steve Jobs and Apple Inc.)
- located in (between Apple Inc. and Cupertino)
- produces (between Apple Inc. and iPhone)
Diagram:
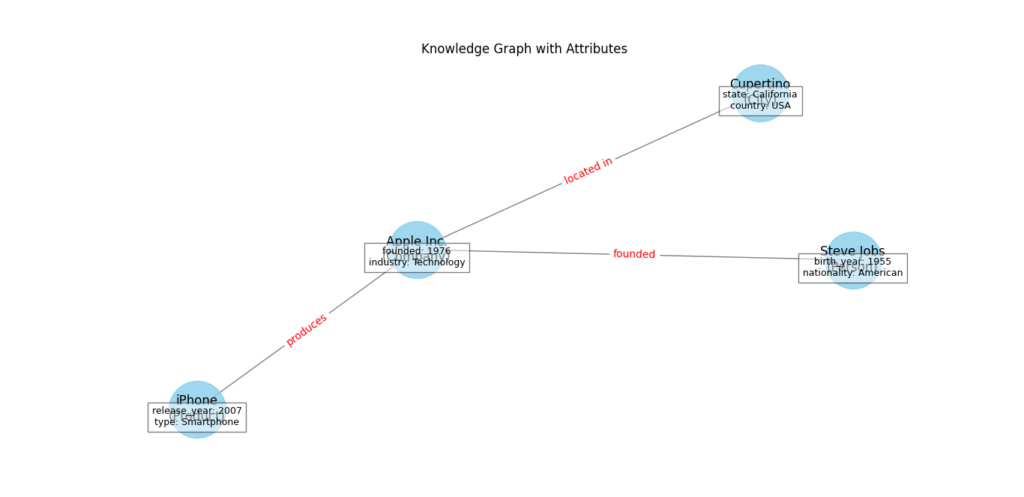
4. Incorporate Attributes
Nodes can have attributes to provide more detailed information about each entity. Attributes are key-value pairs that describe properties of the entity.
Example:
- Steve Jobs: {Birth Year: 1955, Nationality: American}
- Apple Inc.: {Founded: 1976, Industry: Technology}
- Cupertino: {State: California, Country: USA}
- iPhone: {Release Year: 2007, Type: Smartphone}
Diagram:
Visualize the Graph
Visualizing a graph means creating a clear, understandable picture of the nodes and edges that make up the knowledge graph. This visualization helps in seeing how entities are connected and understanding their attributes. Here’s a detailed look at how to do this, along with the tools that can help.
Steps to Visualize a Graph
- Select the Data:
- Choose the entities and relationships you want to visualize. This can include people, places, things, and the connections between them.
- Structure the Graph:
- Arrange your data into nodes (entities) and edges (relationships). Each node represents an entity, and each edge represents a relationship.
- Choose a Tool:
- Various tools can help you create and visualize your graph. These tools range from specialized graph databases to visualization software.
Tools for Visualization
Graph Databases:
- Neo4j:
- What It Is: Neo4j is a powerful graph database that allows you to store and query data in the form of a graph.
- How It Helps: It provides a visual interface to explore your graph, making it easier to see connections and patterns.
- Use Case: Imagine you have data about authors and books. You can use Neo4j to visualize which authors wrote which books and see connections between different books and authors.
- Amazon Neptune:
- What It Is: Amazon Neptune is a fully managed graph database service provided by Amazon Web Services (AWS).
- How It Helps: It supports both property graphs and RDF (Resource Description Framework) graphs, allowing for flexible data modeling.
- Use Case: If you have a social network dataset, Amazon Neptune can help you visualize connections between people, such as friendships and common interests.
Visualization Tools:
- Gephi:
- What It Is: Gephi is an open-source graph visualization and exploration tool.
- How It Helps: It offers powerful layout algorithms and visual tools to analyze and visualize large networks.
- Use Case: If you have a dataset of Twitter interactions, Gephi can help you visualize the network of tweets, retweets, and mentions, making it easier to see the most influential users and trending topics.
- Cytoscape:
- What It Is: Cytoscape is an open-source software platform primarily used for visualizing complex networks and integrating these with any type of attribute data.
- How It Helps: It is widely used in bioinformatics for visualizing molecular interaction networks.
- Use Case: If you are working with biological data, such as protein-protein interactions, Cytoscape can help you visualize these complex networks and identify key proteins involved in certain biological processes.
- Graphviz:
- What It Is: Graphviz is an open-source graph visualization software.
- How It Helps: It provides a way of representing structural information as diagrams of abstract graphs and networks.
- Use Case: For software engineering projects, Graphviz can be used to visualize code structure, showing how different components and modules interact with each other.
Maintaining a Knowledge Graph
Keeping a knowledge graph updated and accurate involves several important tasks:
- Data Integration:
You need to regularly add new data sources to the knowledge graph. This helps keep the information current. For example, if new articles or reports come out, their data should be added to the graph. - Entity Resolution:
It’s important to ensure that each entity in the graph is unique. Sometimes, the same entity might be mentioned in different ways. For instance, “IBM” might also be called “International Business Machines.” Both should be recognized as the same entity. This process is called resolving duplicates. - Relationship Validation:
You need to check the relationships between entities to make sure they are correct. This means verifying that the connections accurately represent how entities are related. For example, if two companies are partners, the relationship in the graph should reflect that accurately. - Graph Expansion:
As new data is added, the graph should grow. This involves adding new entities, relationships, and attributes. For instance, if a new person or place is mentioned, it should be added as a new node, with connections to other related entities. - Graph Optimization:
To make the graph efficient for querying and analysis, you need to optimize it. This means organizing it in a way that allows for quick searches and easy access to information. Optimization ensures that the graph works well even as it grows larger.
By doing these tasks, you can maintain a knowledge graph that is accurate, up-to-date, and useful for finding and understanding information.
Practical Applications of Knowledge Graphs
Knowledge graphs are used in various practical ways to improve how we search for information, make recommendations, provide customer support, analyze business data, and enhance healthcare:
- Search Engines:
They make search engines more accurate by understanding how different search terms are related. For example, Google’s Knowledge Graph helps by showing related concepts when you search for something, making search results more relevant. - Recommendation Systems:
They offer personalized suggestions based on connections between users, products, and preferences. For instance, Netflix uses knowledge graphs to recommend movies and shows that are similar to what you’ve watched before. - Customer Support:
They improve customer service by linking customer questions with relevant information from a knowledge base. This helps in quickly finding solutions and answering queries effectively. - Business Intelligence:
They analyze complex business data to find insights and trends. By visualizing connections within data, knowledge graphs help businesses understand relationships between different factors like sales, customer behavior, and market trends. - Healthcare:
They aid medical research and patient care by connecting data from various sources such as medical records and research papers. This integration helps doctors and researchers find relevant information quickly and make informed decisions.
These applications show how knowledge graphs are used to organize and utilize information in ways that benefit everyday tasks and complex analyses across different fields.
Example: Building a Knowledge Graph for a Tech Company
1: Data Collection
Collect data from company documents, news articles, and social media posts about the company’s products, key personnel, and partnerships.
2: Entity Extraction
Entity extraction means identifying and pulling out important pieces of information from text. These pieces are called entities, and they can be names of people, places, organizations, or other key objects. Let’s look at a simple Python example to see how this works:
from transformers import pipeline

# Load pre-trained NER model
nlp = pipeline("ner", model="dbmdz/bert-large-cased-finetuned-conll03-english")

text = "Elon Musk founded SpaceX in 2002. Tesla is another company he leads."

# Extract entities
entities = nlp(text)
print("Entities:", entities)
Here’s what each part of the code does:
- Import the Pipeline: We start by importing the
pipelinefunction from thetransformerslibrary. This library provides tools for working with pre-trained language models. - Load the Pre-trained NER Model: We use the
pipelinefunction to load a pre-trained Named Entity Recognition (NER) model. This model has been trained to recognize entities in English text. We specify the model name as"dbmdz/bert-large-cased-finetuned-conll03-english". - Define the Text: We create a string variable called
textthat contains the text we want to analyze. In this example, the text is:"Elon Musk founded SpaceX in 2002. Tesla is another company he leads." - Extract Entities: We call the
nlpfunction with the text as an argument. This function processes the text and extracts the entities. The result is stored in a variable calledentities. - Print the Entities: Finally, we print the extracted entities. The output will show the entities found in the text along with their types (e.g., person, organization, etc.).
When you run this code, the output might look something like this:
Entities: [{'entity': 'B-PER', 'score': 0.9995, 'index': 1, 'start': 0, 'end': 9, 'word': 'Elon Musk'},
           {'entity': 'B-ORG', 'score': 0.9996, 'index': 3, 'start': 18, 'end': 24, 'word': 'SpaceX'},
           {'entity': 'B-ORG', 'score': 0.9993, 'index': 10, 'start': 37, 'end': 42, 'word': 'Tesla'}]
This output shows that the model identified “Elon Musk” as a person (B-PER), “SpaceX” as an organization (B-ORG), and “Tesla” as another organization (B-ORG). The score indicates how confident the model is about each identification.
3: Relationship Extraction
After identifying important pieces of information (entities), the next step is to find out how these entities are connected. This means identifying relationships between them. Let’s look at a simple Python example to see how this works:
relationships = [
    {"source": "Elon Musk", "target": "SpaceX", "relationship": "founded"},
    {"source": "Elon Musk", "target": "Tesla", "relationship": "leads"}
]
Here’s what each part of the code does:
- Define Relationships: We create a list called
relationships. This list contains dictionaries that describe the connections between entities. - Describe Each Relationship: Each dictionary in the list has three key pieces of information:
source: This is the starting entity of the relationship. For example, “Elon Musk.”target: This is the ending entity of the relationship. For example, “SpaceX.”relationship: This describes the nature of the connection between the source and target. For example, “founded.”
- Example Relationships:
- The first dictionary shows that “Elon Musk” is connected to “SpaceX” with the relationship “founded.” This means Elon Musk founded SpaceX.
- The second dictionary shows that “Elon Musk” is connected to “Tesla” with the relationship “leads.” This means Elon Musk leads Tesla.
These relationships help us understand how different pieces of information are related to each other. In this example, we see that Elon Musk has important roles in both SpaceX and Tesla. By identifying and describing these relationships, we can create a more complete picture of how entities are connected.
4: Graph Construction
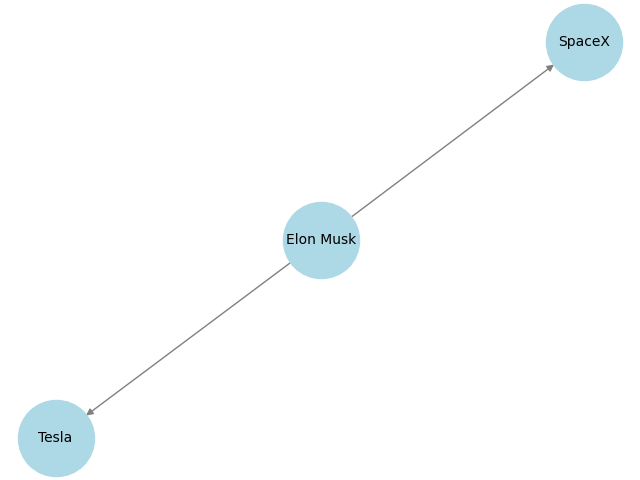
Now, let’s build a visual representation of the entities and relationships we identified. This is done by constructing a graph. Here’s a simple Python example using the networkx and matplotlib libraries:
import networkx as nx
import matplotlib.pyplot as plt

# Initialize a directed graph
G = nx.DiGraph()

# Add nodes and edges based on extracted entities and relationships
G.add_node("Elon Musk", type="Person")
G.add_node("SpaceX", type="Organization")
G.add_node("Tesla", type="Organization")
G.add_edge("Elon Musk", "SpaceX", relationship="founded")
G.add_edge("Elon Musk", "Tesla", relationship="leads")

# Draw the graph
nx.draw(G, with_labels=True, node_color='lightblue', edge_color='gray', node_size=3000, font_size=10)
plt.title("Knowledge Graph of Tech Company")
plt.show()
Here’s what each part of the code does:
- Import Libraries: We start by importing the
networkxlibrary for creating and handling graphs, andmatplotlib.pyplotfor drawing the graph. - Initialize a Directed Graph: We create a directed graph using
nx.DiGraph(). A directed graph means the connections (edges) have a direction, indicating the relationship flows from one entity to another. - Add Nodes and Edges:
- We add nodes to the graph using
G.add_node(). Each node represents an entity. For example, “Elon Musk” is a person, and “SpaceX” and “Tesla” are organizations. - We add edges to the graph using
G.add_edge(). Each edge represents a relationship between two entities. For example, “Elon Musk” is connected to “SpaceX” with the relationship “founded.”
- We add nodes to the graph using
- Draw the Graph:
- We use
nx.draw()to draw the graph. Thewith_labels=Trueargument shows the names of the nodes. - We customize the graph’s appearance with
node_color='lightblue'to color the nodes,edge_color='gray'to color the edges,node_size=3000to set the size of the nodes, andfont_size=10to set the size of the labels. - We set a title for the graph with
plt.title("Knowledge Graph of Tech Company"). - Finally, we display the graph using
plt.show().
- We use
When you run this code, you’ll see a visual representation of the knowledge graph. It will show “Elon Musk” connected to “SpaceX” and “Tesla” with the relationships “founded” and “leads,” respectively. This graph helps us see and understand the connections between different entities in a clear and organized way.
5: Graph Enrichment
To make our knowledge graph more informative, we can add extra details to the entities and relationships. This process is called graph enrichment. Let’s look at a simple Python example to see how this works:
G.nodes["Elon Musk"]["birthdate"] = "1971-06-28"
G.nodes["SpaceX"]["founded_year"] = 2002
G.nodes["Tesla"]["industry"] = "Automotive"
Here’s what each part of the code does:
- Add Attributes to “Elon Musk”:
- We add a birthdate attribute to the “Elon Musk” node. This gives us more information about him. The code
G.nodes["Elon Musk"]["birthdate"] = "1971-06-28"adds his birthdate.
- We add a birthdate attribute to the “Elon Musk” node. This gives us more information about him. The code
- Add Attributes to “SpaceX”:
- We add a founded_year attribute to the “SpaceX” node. This tells us when the company was founded. The code
G.nodes["SpaceX"]["founded_year"] = 2002adds this detail.
- We add a founded_year attribute to the “SpaceX” node. This tells us when the company was founded. The code
- Add Attributes to “Tesla”:
- We add an industry attribute to the “Tesla” node. This gives us information about the industry Tesla operates in. The code
G.nodes["Tesla"]["industry"] = "Automotive"adds this detail.
- We add an industry attribute to the “Tesla” node. This gives us information about the industry Tesla operates in. The code
By adding these attributes, we enrich the graph with more information. This makes the graph more useful and provides a better understanding of the entities and their relationships.
Now, the enriched graph includes extra details like:
- Elon Musk’s birthdate.
- The year SpaceX was founded.
- The industry Tesla belongs to.
These additional details help us get a clearer picture of the entities and their context within the knowledge graph.
6: Graph Storage
To store the knowledge graph for efficient querying and analysis, we use a graph database like Neo4j. Here’s a simple Python example to see how this works:
from neo4j import GraphDatabase

# Connect to Neo4j database
driver = GraphDatabase.driver("bolt://localhost:7687", auth=("neo4j", "password"))

def create_graph(tx):
    tx.run("CREATE (:Person {name: 'Elon Musk', birthdate: '1971-06-28'})")
    tx.run("CREATE (:Organization {name: 'SpaceX', founded_year: 2002})")
    tx.run("CREATE (:Organization {name: 'Tesla', industry: 'Automotive'})")
    tx.run("""
        MATCH (p:Person {name: 'Elon Musk'}), (o:Organization {name: 'SpaceX'})
        CREATE (p)-[:FOUNDED]->(o)
    """)
    tx.run("""
        MATCH (p:Person {name: 'Elon Musk'}), (o:Organization {name: 'Tesla'})
        CREATE (p)-[:LEADS]->(o)
    """)

with driver.session() as session:
    session.write_transaction(create_graph)
Here’s what each part of the code does:
- Import Neo4j Library: We start by importing the
GraphDatabaseclass from theneo4jlibrary. This library provides tools to interact with a Neo4j graph database. - Connect to Neo4j Database: We create a connection to the Neo4j database using the
GraphDatabase.driver()method. The connection details include the database URL ("bolt://localhost:7687") and the authentication credentials (auth=("neo4j", "password")). - Define a Function to Create the Graph: We define a function called
create_graph(tx)to create the graph in the database. Inside this function:- We use the
tx.run()method to execute Cypher queries. Cypher is the query language for Neo4j. - We create nodes for “Elon Musk,” “SpaceX,” and “Tesla” with their attributes (name, birthdate, founded_year, and industry).
- We create relationships between the nodes. We match the nodes using the
MATCHkeyword and then create the relationships using theCREATEkeyword.
- We use the
- Run the Function in a Session:
- We open a session with the
driver.session()method. - We use
session.write_transaction(create_graph)to run thecreate_graphfunction in a write transaction. This means the function will make changes to the database.
- We open a session with the
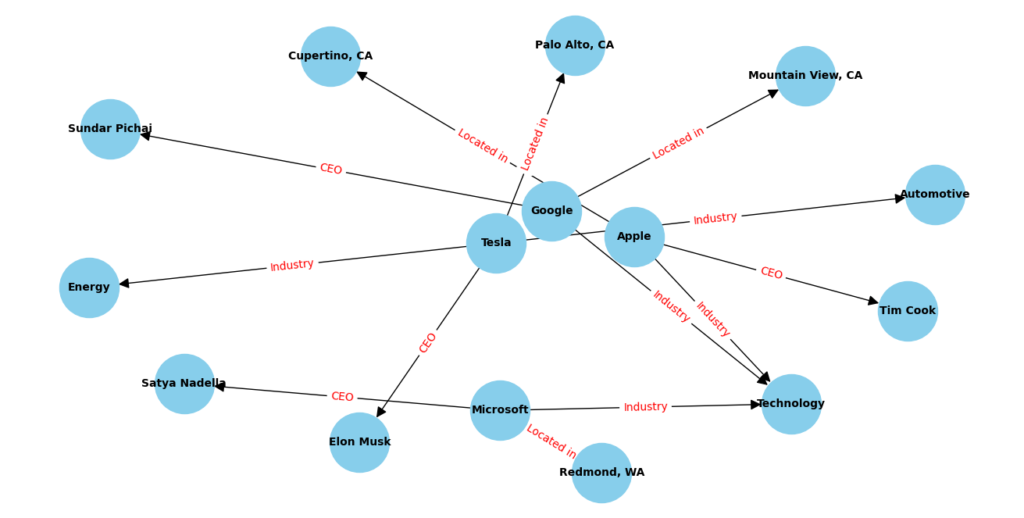
By running this code, the knowledge graph is stored in the Neo4j database. This allows for efficient querying and analysis of the graph. You can now use Neo4j’s powerful querying capabilities to explore and analyze the relationships and entities in your knowledge graph. Here is an expanded Knowledge Graph with additional nodes, edges, and attributes.
Benefits of Automated Knowledge Graph Construction with LLMs
Increased Efficiency
Automating knowledge graph construction with LLMs reduces the manual effort involved in extracting entities and relationships. This automation speeds up the process and allows for handling larger datasets.
Improved Accuracy
LLMs are trained on extensive data and can understand complex language patterns. This capability enhances the accuracy of the extracted entities and relationships, leading to more reliable knowledge graphs.
Scalability
As the volume of data grows, automated systems powered by LLMs can scale more effectively than manual methods. They can continuously update and expand knowledge graphs as new information becomes available.
Advanced Topics and Future Trends
Emerging Trends
- Combining with Other AI Technologies:
Large language models (LLMs) are becoming more powerful when used together with other AI techniques. For example, combining LLMs with computer vision helps machines understand and describe images or videos better. When LLMs are used with speech recognition, they can understand and respond to spoken words more accurately. This creates more detailed and useful knowledge graphs, which are like maps of information that help us understand how different pieces of data are connected. - Real-time Updates:
It is important for knowledge graphs to be updated as soon as new information is available. This means creating systems that can automatically refresh the data in the knowledge graph whenever there are new inputs. For example, if there is new information about a scientific discovery or a news event, the knowledge graph should reflect this immediately. This keeps the information current and accurate. - Enhanced Personalization:
Knowledge graphs can be made more useful by tailoring them to individual users. This means creating graphs that change based on what a user likes, needs, or searches for often. For instance, if someone frequently searches for information about a specific topic, the knowledge graph can prioritize and highlight related data. This makes the information more relevant and helpful for each person.
By focusing on these trends, we can make LLMs and knowledge graphs smarter and more useful for everyone.
Conclusion
Automating knowledge graph construction with LLMs is a powerful approach that can revolutionize how we manage and utilize information. By using LLMs, organizations can build accurate, scalable, and efficient knowledge graphs that enhance their data analysis capabilities. This blog post has explored the benefits of using LLMs for knowledge graph automation, provided a detailed implementation guide, and discussed future trends in the field.
As technology continues to advance, the integration of LLMs with knowledge graphs will offer even more opportunities for innovation and efficiency in data management. Whether you’re a data scientist, AI enthusiast, or business leader, understanding and implementing these techniques will be crucial for staying ahead in the data-driven world.
External Resources
- Neo4j’s Knowledge Graphs – A comprehensive guide to building and querying knowledge graphs using Neo4j.
- Google’s Knowledge Graph – Learn about Google’s Knowledge Graph and its application in search engines.
FAQs
What is a knowledge graph?
A knowledge graph is a structured representation of knowledge that captures relationships between entities, allowing for efficient data organization and retrieval. In Python, knowledge graphs are often implemented using graph databases like Neo4j or libraries like NetworkX.
How do I create a knowledge graph in Python?
You can create a knowledge graph in Python using libraries like NetworkX for graph representation or tools like RDFlib for working with RDF (Resource Description Framework) data. Start by defining entities (nodes) and their relationships (edges) within your dataset.
What are some popular Python libraries for working with knowledge graphs?
Popular Python libraries for working with knowledge graphs include:
- NetworkX: For creating, manipulating, and studying complex networks and graphs.
- RDFlib: For working with RDF data and building semantic web applications.
- Py2neo: A client library and toolkit for working with Neo4j graph databases.
How can knowledge graphs be used in Python applications?
Knowledge graphs in Python can be used for various applications such as:
- Semantic search and recommendation systems.
- Entity resolution and data integration.
- Natural language processing (NLP) tasks like entity extraction and relation prediction.
- Visualizing complex relationships and dependencies in data.
What are the benefits of using knowledge graphs in Python?
Using knowledge graphs in Python offers several benefits, including:
- Improved data organization and query efficiency.
- Enhanced ability to discover hidden patterns and insights in data.
- Facilitation of complex data integration and interoperability.
- Support for building intelligent applications with semantic understanding.
Can I visualize a knowledge graph created in Python?
Yes, you can visualize knowledge graphs created in Python using libraries like NetworkX combined with Matplotlib or using tools like Neo4j’s visualization capabilities. These visualizations help in understanding the structure and relationships within the graph, making it easier to derive insights from complex data.





Leave a Reply