
10 Powerful Python Libraries for Data Science You Haven’t Tried Yet
Introduction
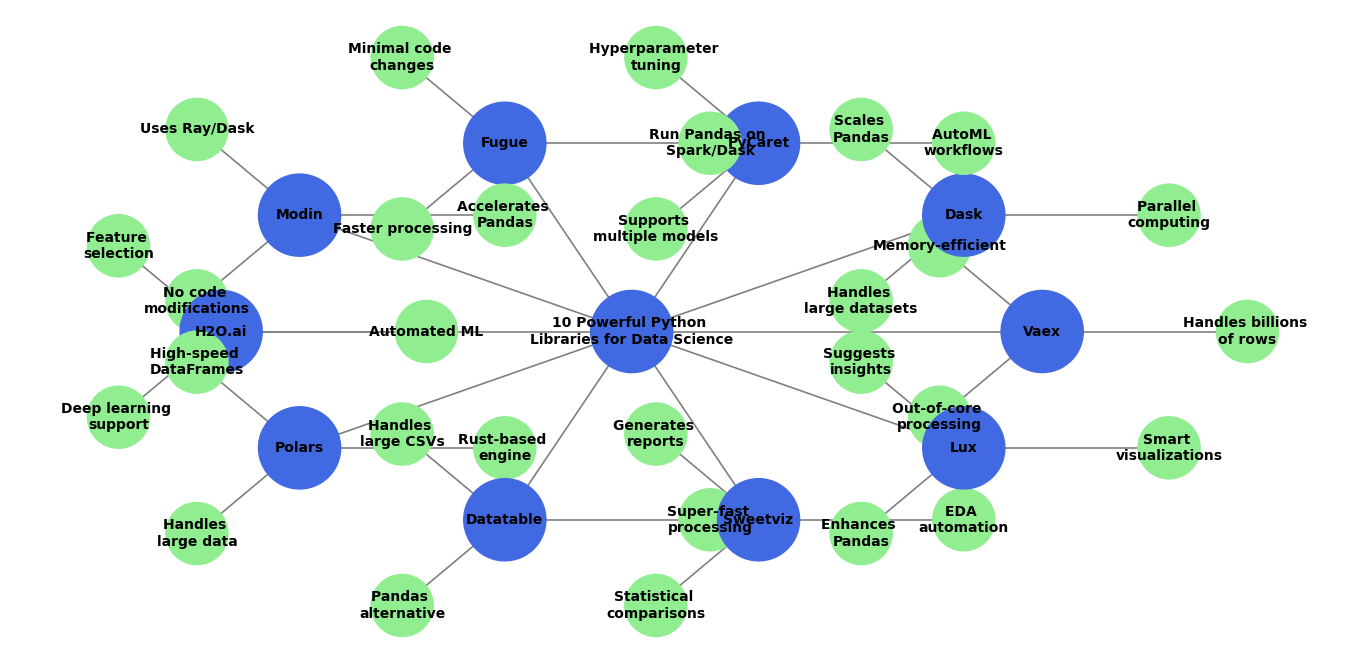
Python Libraries for Data Science: Python is one of the best programming languages for data science. It has many useful libraries that helps data analysis, machine learning, and AI. You already knew some of the popular python libraries like Pandas, NumPy, and Scikit-Learn. But, You may not Know there are still many hidden gems that can makes your work easier.
In this post, I’ll introduce 10 lesser-known Python libraries. That can help you with data visualization, feature engineering, deep learning, and automation. These tools can save your time, improve accuracy, and helps you work smarter.
If you’re a data scientist, analyst, or AI enthusiast, these powerful Python libraries will take your skills to the next level. Let’s explore them one by one!
Why You Need These Hidden Python Libraries
Many data scientists struggle with:
- Processing speeds which is very slow while handling large datasets in Pandas
- Repetitive and time-consuming machine learning tasks
- It is impossible to write the very long error free codes for Complex datas
- Basic visualization tools doesn’t provide us deeper insights
These 10 Python libraries can solve these problems without extra effort. They are designed to speed up data processing, automate tedious tasks, and enhance machine learning workflows.
What You’ll Learn
In this post, you’ll discover:
- Faster alternatives to Pandas for handling big data (Vaex, Dask, Modin, Polars, Datatable)
- AutoML tools that automate machine learning model selection (PyCaret, H2O.ai)
- Libraries that simplify data transformations (Fugue)
- Smart visualization tools that generate insights instantly (Sweetviz, Lux)
Let’s dive into each library, see what it does, and learn how it can improve your data science workflow.
1. Vaex – A Faster Alternative to Pandas for Big Data
What is Vaex?
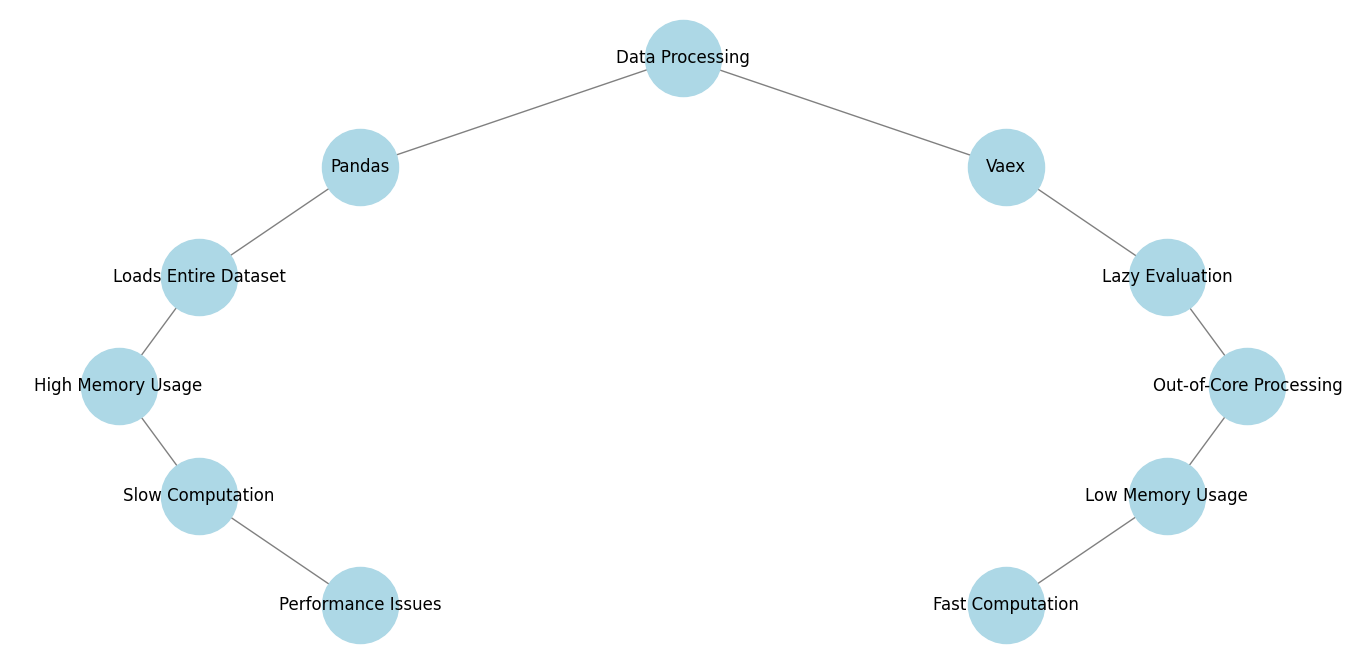
Pandas is a great tool for working with data in Python. But the real problem occurs when your data grows too big, Pandas gets slow and it is forced to uses too much RAM (memory).
To overcome this problem. Python as another best hidden gem that is Vaex. Vaex is a special DataFrame library which is built to handle huge datasets (millions or even billions of rows) without slowing down your computer.
Let’s see how Vaex overcome this problem. It does not load all data from the memory. Instead, it reads the data only when needed, making it much faster and more memory-efficient than Pandas.
Why is Vaex Faster Than Pandas?
Here are a few reasons why Vaex performs better with large datasets:
- Doesn’t load everything from memory – It reads data only when necessary, so your computer doesn’t slow down.
- Lazy execution – Vaex doesn’t do calculations immediately; instead, it waits until you need the final result, saving processing time.
- Optimized for large files – It can work with datasets that are much larger than your RAM, meaning it won’t crash even with billions of rows.
- Faster filtering and calculations – Common operations like finding rows, calculating averages, and grouping data run much quicker than in Pandas.
How Does Vaex Work? (With Code Examples)
To understand the difference between Vaex and Pandas, let’s look at some real examples.
1. Loading a Large Dataset
Let’s say you have a huge CSV file with millions of rows of data.
Using Pandas (Slow and Memory-Heavy)
import pandas as pd

# Load a large dataset
df = pd.read_csv("big_data.csv")

# Check number of rows and columns
print(df.shape)
Problem: Pandas loads everything into RAM, which can make your computer slow or crash because the file is too big.
Using Vaex (Fast and Memory-Efficient)
import vaex

# Load the same dataset
df = vaex.open("big_data.csv")

# Check number of rows and columns
print(df.shape)
Why is Vaex better? Instead of loading the whole file into memory, Vaex just reads it when needed, keeping your computer fast.
2. Filtering Data (Finding Specific Information Faster)
Let’s say you want to find all people older than 30 in a dataset containing personal details.
Using Pandas (Slower)
# Get all people older than 30
filtered_df = df[df['age'] > 30]
Since Pandas processes everything in memory, filtering large datasets takes a long time.
Using Vaex (Faster)
# Get all people older than 30
filtered_df = df[df.age > 30]
Vaex is much faster because it doesn’t process everything immediately. Instead, It only computes the result when needed.
Calculating the Average of a Column
Now, let’s calculate the average salary from a dataset.
Using Pandas (Slow on Large Data)
mean_salary = df['salary'].mean()
print(mean_salary)
Problem: Pandas loads all salary data into memory, which can be slow for large datasets.
Using Vaex (Optimized for Speed & Memory)
mean_salary = df.salary.mean()
print(mean_salary)
Vaex is much faster because it doesn’t store unnecessary data in memory.
4. Grouping Data Efficiently
If you want to group employees by their job title and calculate the average salary for each job.
Using Pandas (Slow & Memory-Intensive)
df.groupby("job_title")["salary"].mean()
Problem: Pandas processes everything in memory, making this slow for large datasets.
Using Vaex (Much Faster)
df.groupby("job_title", agg=vaex.agg.mean("salary"))
5. Exporting Data (Saving to a File Faster)
If you want to save your results to a new file, Vaex is much faster than Pandas.
Using Pandas (Takes Longer)
df.to_csv("output.csv", index=False)
Problem: Pandas writes data row by row, making it slow for big files.
Using Vaex (Much Faster)
df.export_csv("output.csv")
Vaex is designed for speed, so it saves files much quicker than Pandas.
When Should You Use Vaex Instead of Pandas?
| Feature | Pandas 🐼 | Vaex 🚀 |
|---|---|---|
| Handles large datasets | ❌ Slow & memory-heavy | ✅ Super fast & memory-efficient |
| Lazy execution | ❌ No | ✅ Yes (only computes when needed) |
| Works with data larger than RAM | ❌ No | ✅ Yes |
| Fast filtering | ❌ No | ✅ Yes |
| Fast calculations | ❌ No | ✅ Yes |
| Optimized for big files | ❌ No | ✅ Yes |
Dask – Parallel Computing for Big Data
Dask is an another hidden best python libraries for data science. let’s explore this in detail.
What is Dask?
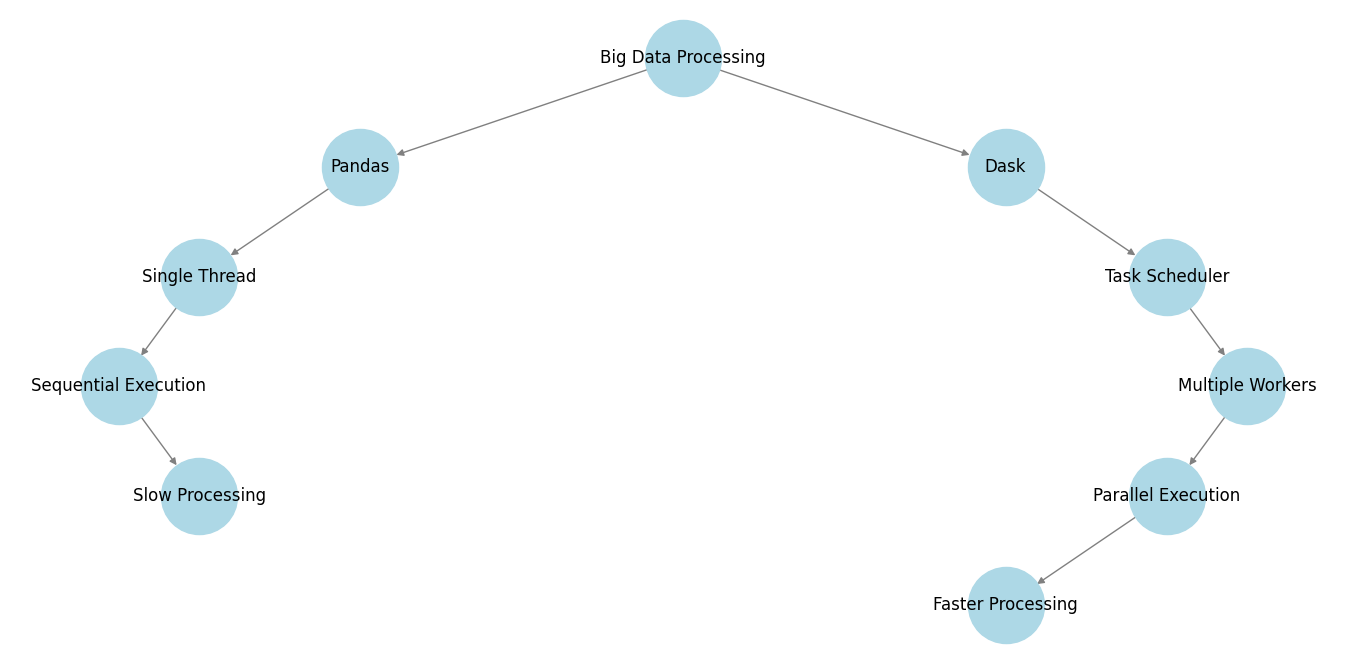
Like Vaex, Dask is also designed to handle big data. It is used to break large computations into smaller, manageable tasks. Pandas, runs operations on a single CPU core. But, Dask automatically runs multiple tasks in parallel using multiple CPU cores or even clusters of machines.
This means Dask can process massive datasets faster than Pandas, especially when working with millions or billions of rows. If you’ve ever waited too long for Pandas to process data, Dask is the only solution.
Why Use Dask Instead of Pandas?
Dask works just like Pandas but is designed for speed and efficiency. Here’s why it’s better for large-scale data science:
- Parallel Processing – Dask splits big computations into smaller tasks that run at the same time on multiple CPU cores.
- Works with Data Larger than RAM – ofcourse, Pandas loads everything into memory, which can crash your system. Dask loads only what’s needed, so it works even if your data is bigger than your RAM.
- Faster Computation – Because Dask distributes tasks across multiple CPU cores, it processes data much quicker than Pandas.
- Seamless Integration with Pandas & NumPy – Dask supports Pandas and NumPy functions, so you don’t have to learn new syntax.
- Works on Clusters – Dask can run on a single laptop or hundreds of servers, making it perfect for big data and cloud computing.
How Does Dask Work? (With Code Examples)
Dask is designed to feel like Pandas, so switching is easy. Let’s compare Pandas and Dask with real-world examples.
1. Installing Dask
First, install Dask using pip:
pip install dask
Now, let’s see how it works!
2. Loading a Large Dataset
Using Pandas (Slow & Memory-Intensive)
import pandas as pd

# Load a large CSV file
df = pd.read_csv("big_data.csv")

# Check number of rows and columns
print(df.shape)
Problem: Pandas loads the entire file into memory, which slows down your computer or even causes it to crash for very large datasets.
Using Dask (Faster & Memory-Efficient)
import dask.dataframe as dd

# Load the same large CSV file
df = dd.read_csv("big_data.csv")

# Check number of rows and columns
print(df.shape.compute())  # Use .compute() to get actual values
Why is Dask better? Instead of loading the whole file at once, Dask reads only small chunks, making it much faster and memory-efficient.
3. Filtering Data Efficiently
Let’s say we need to find all employees who earn more than $50,000.
Using Pandas (Slow for Large Data)
high_salary = df[df["salary"] > 50000]
print(high_salary)
Problem: Pandas loads all rows into memory, making it slow for big files.
Using Dask (Faster with Parallel Processing)
high_salary = df[df["salary"] > 50000].compute()
print(high_salary)
Dask splits the task into smaller parts and processes them in parallel, making filtering much faster.
4. Calculating Aggregates (Mean, Sum, Count)
Let’s say we want to calculate the average salary.
Using Pandas (Slower for Big Data)
avg_salary = df["salary"].mean()
print(avg_salary)
Problem: Pandas processes everything on a single CPU core, making it slow for large datasets.
Using Dask (Faster with Parallel Computation)
avg_salary = df["salary"].mean().compute()
print(avg_salary)
Dask splits the computation across multiple CPU cores, making it much faster than Pandas.
5. Grouping Data for Analysis
Let’s say we want to group employees by job title and calculate the average salary for each group.
Using Pandas (Slow for Large Data)
df.groupby("job_title")["salary"].mean()
Problem: Pandas loads everything into memory, slowing down the process.
Using Dask (Optimized for Large-Scale Computation)
df.groupby("job_title")["salary"].mean().compute()
Dask distributes the work across multiple CPU cores, making group operations much faster.
6. Running Dask on a Cluster (For Extreme Performance)
Dask can also run on multiple machines (a cluster) for super-fast processing.
from dask.distributed import Client

# Start a Dask cluster
client = Client(n_workers=4)  # Use 4 CPU cores

# Now Dask runs on multiple cores, making everything even faster!
This means Dask is not just for your laptop – it can scale to big servers or cloud platforms like AWS, Google Cloud, and Azure.
When Should You Use Dask Instead of Pandas?
| Feature | Pandas 🐼 | Dask ⚡ |
|---|---|---|
| Handles large datasets | ❌ No (Slow & Memory-Heavy) | ✅ Yes (Processes Large Data Efficiently) |
| Parallel Processing | ❌ No (Uses 1 CPU Core) | ✅ Yes (Uses Multiple CPU Cores) |
| Works with Data Larger than RAM | ❌ No (Crashes on Large Files) | ✅ Yes (Loads Only What’s Needed) |
| Fast Filtering & Aggregation | ❌ No | ✅ Yes |
| Scales to Clusters | ❌ No | ✅ Yes |
PyCaret – Automated Machine Learning (AutoML)
Here is the another one Pycaret.
What is PyCaret?
PyCaret is a low-code Python library that automates machine learning (AutoML). Instead of writing long and complex ML code, PyCaret simplifies the entire process—from data preprocessing to model training, tuning, and evaluation.
With just a few lines of code, you can:
- Train multiple models automatically
- Select the best-performing model
- Optimize hyperparameters
- Deploy models easily
PyCaret is perfect for beginners and time-saving for experts who don’t want to spend hours fine-tuning models manually.
Why Use PyCaret?
- Automates Everything – PyCaret handles data preprocessing, model training, and evaluation in just a few lines of code.
- Supports Multiple Machine Learning Models – It tests different models like Random Forest, XGBoost, SVM, and Neural Networks automatically.
- Hyperparameter Tuning – It optimizes model performance without needing manual adjustments.
- Easy Deployment – PyCaret integrates with Flask, FastAPI, and cloud services for quick deployment.
- Works with Pandas & Dask – You can load data from CSV, SQL, or big data frameworks like Dask.
How to Use PyCaret? (With Code Examples)
Let’s see how PyCaret automates the entire machine learning workflow.
1. Install PyCaret
Before using PyCaret, install it using pip:
pip install pycaret
2. Load a Sample Dataset
Let’s use the famous Titanic dataset, where we predict if a passenger survived based on their characteristics.
import pandas as pd
from pycaret.classification import *

# Load the Titanic dataset
df = pd.read_csv("https://raw.githubusercontent.com/datasciencedojo/datasets/master/titanic.csv")

# Drop unnecessary columns
df = df.drop(["Name", "Ticket", "Cabin"], axis=1)

# View the first few rows
print(df.head())
3. Set Up PyCaret (Automatic Data Preprocessing)
Before training models, PyCaret automatically preprocesses data:
- Handles missing values
- Encodes categorical variables
- Splits the dataset into training and testing sets
# Define the target variable (Survived) and initialize PyCaret
clf = setup(df, target="Survived", silent=True)
Why is this amazing? Normally, we’d write many lines of code for preprocessing, but PyCaret does everything automatically!
4. Train & Compare Multiple Models Automatically
Instead of manually training models one by one, PyCaret trains multiple models and ranks them by accuracy!
# Train multiple models and compare performance
best_model = compare_models()
Output: PyCaret generates a table comparing models like:
Model           Accuracy   Precision  Recall  F1-score
-------------------------------------------------------
Random Forest   85.6%      84.5%      86.2%   85.3%
XGBoost         84.8%      83.9%      85.6%   84.7%
SVM             82.1%      80.5%      81.9%   81.2%
Logistic Reg.   80.4%      78.3%      79.5%   78.9%
PyCaret automatically picks the best model (e.g., Random Forest) for us!
5. Tune the Best Model (Auto Hyperparameter Tuning)
PyCaret can fine-tune the best model automatically for better performance.
# Tune the best model automatically
tuned_model = tune_model(best_model)
Why is this useful? Normally, we would manually try different hyperparameters (like n_estimators for Random Forest), but PyCaret does it for us!
6. Make Predictions on New Data
After training and tuning, we can use the model to make predictions.
# Predict survival on test data
predictions = predict_model(tuned_model, data=df)
print(predictions[["Survived", "Label"]])
Output:
Survived  Label
0         1
1         0
1         1
0         0
1         1
The “Label” column shows the model’s predicted survival outcomes.
7. Save and Deploy the Model
Once the model is ready, we can save it and use it in real-world applications.
# Save the model
save_model(tuned_model, "best_titanic_model")

# Load the model later for deployment
loaded_model = load_model("best_titanic_model")

# Predict using the loaded model
new_predictions = predict_model(loaded_model, data=df)
Why is this powerful? You can deploy the trained model in web apps, APIs, or cloud platforms without retraining.
When Should You Use PyCaret?
| Feature | Traditional ML | PyCaret (AutoML) |
|---|---|---|
| Data Preprocessing | ✅ Manual | ✅ Automatic |
| Train Multiple Models | ❌ Time-Consuming | ✅ Done in One Command |
| Hyperparameter Tuning | ❌ Manual | ✅ Auto-Tuning |
| Model Comparison | ❌ Manual | ✅ Automatic Ranking |
| Deployment | ❌ Complex | ✅ Easy & Quick |
If you want to train models fast and save time, PyCaret is the best choice!
Fugue – Simplifying Distributed Computing (Pandas, Spark, Dask)
What is Fugue?
Fugue is the another Python tool that helps you work with big data without changing your code.
Normally, you use Pandas to handle data. But Pandas struggles with large files. If you want to work with huge datasets, you need Dask or Spark—which can be complicated to learn.
Fugue solves this problem. Here you can write your code in Pandas and automatically scale it up to Dask or Spark when needed.
In short: You write code once, and Fugue makes it work on small or big data without changes!
Why Use Fugue?
- Works with Pandas – You don’t need to learn new coding styles.
- Handles big data – Runs smoothly even when the data is too large for Pandas.
- Switches between Pandas, Dask, and Spark – Automatically adjusts depending on the dataset size.
- Faster execution – Uses parallel computing to process data much quicker.
Simple Example – Using Fugue with Pandas
Let’s start with a small dataset using Pandas.
import pandas as pd

# Creating a small dataset
df = pd.DataFrame({
    "name": ["Alice", "Bob", "Charlie"],
    "salary": [50000, 60000, 70000]
})

print(df)
Output:
     name  salary
0  Alice   50000
1    Bob   60000
2 Charlie  70000
Now, let’s say we want to increase everyone’s salary by 10%.
def increase_salary(df: pd.DataFrame) -> pd.DataFrame:
    df["salary"] = df["salary"] * 1.1
    return df

df = increase_salary(df)
print(df)
Output:
     name   salary
0  Alice  55000.0
1    Bob  66000.0
2 Charlie  77000.0
So far, this is just basic Pandas. Now, let’s scale this to big data using Fugue.
Scaling Up – Run the Same Code on Dask (Big Data Processing)
Install Fugue and Dask
pip install fugue dask
Convert Pandas Code to Run on Dask (Parallel Computing)
import dask.dataframe as dd
from fugue import transform

# Convert Pandas DataFrame to Dask DataFrame
dask_df = dd.from_pandas(df, npartitions=2)

# Apply the function using Fugue
result = transform(dask_df, increase_salary)

print(result.compute())  # Convert back to Pandas for display
What changed?
✔ We used the same Python function but ran it on Dask to handle millions of rows.
✔ Dask splits the data into smaller parts and processes them in parallel, making it much faster.
Scaling Up More – Run the Same Code on Spark (Super Big Data Processing)
Install Fugue and Spark
pip install fugue pyspark
Run the Same Code on Spark
from pyspark.sql import SparkSession
from fugue_spark import SparkExecutionEngine

# Create a Spark session
spark = SparkSession.builder.appName("FugueExample").getOrCreate()

# Convert Pandas DataFrame to Spark DataFrame
spark_df = spark.createDataFrame(df)

# Run the same transformation on Spark
result = transform(spark_df, increase_salary, engine=SparkExecutionEngine)

result.show()
What changed?
✔ The same Python function ran on Spark, which is used for huge datasets.
✔ No need to learn Spark’s complicated syntax!
Must Read
- ML Model Monitoring: How to Detect Data Drift and Model Decay in Production
- Retrain vs Fine-Tune vs Train from Scratch: A Decision Framework for ML Engineers
- Continual Learning in PyTorch: A Practical Guide for ML Engineers
- Online Learning Machine Learning: Building Real-Time Streaming Systems in Python
- How to Prevent Catastrophic Forgetting in PyTorch (Complete Guide)
Modin – Speed Up Pandas Operations Automatically
What is Modin?
Modin is a Python library that makes Pandas run much faster without changing your code.
Already we know that pandas always struggling with large datasets. Modin solves this by using multiple CPU cores at once, speeding up everything automatically.
In short: If you use import pandas as pd, just replace it with import modin.pandas as pd, and your code runs much faster!
Why Use Modin?
- No code changes – Just change one line, and Pandas operations become faster.
- Works on big data – Can handle datasets larger than your computer’s memory.
- Uses multiple CPU cores – Instead of using just one core, Modin divides work across all available cores for faster execution.
- Compatible with Pandas – If your code works with Pandas, it will work with Modin.
Installing Modin
pip install modin[all]
This will install Modin along with Dask and Ray, which help with parallel processing.
How to Use Modin?
Step 1: Normal Pandas Code (Slow Execution)
import pandas as pd

# Creating a large DataFrame
df = pd.DataFrame({"A": range(1, 10_000_000), "B": range(10_000_000, 1, -1)})

# Filtering operation (slow in Pandas)
filtered_df = df[df["A"] > 5_000_000]

print(filtered_df.shape)
This will take a long time if your dataset is large.
Step 2: Speed It Up with Modin (Faster Execution)
import modin.pandas as pd

# Creating the same large DataFrame
df = pd.DataFrame({"A": range(1, 10_000_000), "B": range(10_000_000, 1, -1)})

# Filtering operation (much faster)
filtered_df = df[df["A"] > 5_000_000]

print(filtered_df.shape)
This runs much faster because Modin automatically uses multiple CPU cores!
Modin vs Pandas – Speed Comparison
Let’s compare reading a large CSV file using Pandas and Modin.
Using Pandas (Slow)
import pandas as pd
df = pd.read_csv("large_dataset.csv")
Using Modin (Fast)
import modin.pandas as pd
df = pd.read_csv("large_dataset.csv")
Modin reads large CSV files up to 10x faster!
H2O.ai – Advanced Machine Learning with AutoML
What is H2O.ai?
H2O.ai is an open-source machine learning platform that helps data scientists and developers build powerful AI models easily. It includes an AutoML (Automated Machine Learning) feature, which automates model selection, training, and tuning so you don’t have to do everything manually.
If you want to train high-performance models without spending hours fine-tuning them, H2O.ai is a great choice.
Why Use H2O.ai?
- AutoML for everyone – Automatically selects the best ML models and hyperparameters.
- Works with Big Data – Can handle large datasets that don’t fit in memory.
- Fast and Scalable – Uses multi-core processing and distributed computing.
- Supports Multiple Algorithms – Includes XGBoost, Random Forest, Deep Learning, and more.
- Easy Integration – Works with Python, R, and even a web-based UI (H2O Flow).
Installing H2O.ai in Python
To use H2O.ai in Python, install it with:
pip install h2o
Then, start the H2O cluster:
import h2o
h2o.init()
This starts H2O’s computing engine, allowing you to train models efficiently.
How to Use H2O.ai for AutoML?
Step 1: Load Dataset into H2O
Instead of using Pandas, H2O uses its own data frame type called H2OFrame:
import h2o
from h2o.automl import H2OAutoML

# Start H2O
h2o.init()

# Load dataset (replace with your own CSV)
data = h2o.import_file("https://raw.githubusercontent.com/mwaskom/seaborn-data/master/iris.csv")

# Check data
data.head()
Step 2: Define Target and Features
Before training, we need to tell H2O which column to predict (target) and which columns to use as features.
# Define target and features
target = "species"
features = data.columns.remove(target)

# Convert target to categorical (for classification problems)
data[target] = data[target].asfactor()
Step 3: Run AutoML and Train the Best Model
H2O AutoML will automatically test different machine learning models and pick the best one.
# Run AutoML for 30 seconds
aml = H2OAutoML(max_runtime_secs=30)
aml.train(x=features, y=target, training_frame=data)
Step 4: Get the Best Model and Make Predictions
After training, H2O will tell you which model performed best. You can then use it to make predictions.
# Show leaderboard (best models ranked)
lb = aml.leaderboard
print(lb)

# Get the best model
best_model = aml.leader

# Make predictions on new data
predictions = best_model.predict(data)
print(predictions)
H2O automatically chooses the best machine learning model for your dataset!
H2O.ai vs. Other AutoML Tools
| Feature | H2O.ai AutoML | PyCaret | Google AutoML |
|---|---|---|---|
| Open Source? | ✅ Yes | ✅ Yes | ❌ No |
| Handles Big Data? | ✅ Yes | ❌ No | ✅ Yes |
| Supports Deep Learning? | ✅ Yes | ✅ Yes | ✅ Yes |
| Easy to Use? | ✅ Yes | ✅ Yes | ✅ Yes |
| Works with Python? | ✅ Yes | ✅ Yes | ✅ No |
H2O.ai is one of the fastest AutoML libraries, great for big datasets and advanced machine learning.
Polars – Lightning-Fast DataFrames
What is Polars?
Polars is a high-performance DataFrame library for Python. It is designed to handle large datasets efficiently, making it much faster and more memory-efficient than Pandas.
Polars achieves this by using:
- Rust programming language (which is much faster than Python).
- Parallel processing (uses multiple CPU cores instead of just one).
- Lazy execution (waits until the last moment to execute commands efficiently).
Now, let’s see step-by-step examples to understand how Polars works and why it’s better than Pandas.
Step 1: Installing Polars
To use Polars, you need to install it first. Run this command in your terminal:
pip install polars
Now, you can start working with Polars in Python.
Step 2: Creating a DataFrame in Polars
A DataFrame is a table (like an Excel sheet). Let’s create one using Polars:
import polars as pl

df = pl.DataFrame({
    "Name": ["Alice", "Bob", "Charlie", "David", "Eve"],
    "Age": [25, 30, 35, 40, 45],
    "Salary": [50000, 60000, 70000, 80000, 90000]
})

print(df)
Output:
shape: (5, 3)
┌─────────┬─────┬────────┐
│ Name    │ Age │ Salary │
├─────────┼─────┼────────┤
│ Alice   │  25 │  50000 │
│ Bob     │  30 │  60000 │
│ Charlie │  35 │  70000 │
│ David   │  40 │  80000 │
│ Eve     │  45 │  90000 │
└─────────┴─────┴────────┘
This looks similar to Pandas but runs much faster.
Step 3: Filtering Data (Selecting Rows Based on a Condition)
Let’s say we want to find people older than 30. In Pandas, this would be slow for large datasets. Polars makes it fast:
filtered_df = df.filter(pl.col("Age") > 30)
print(filtered_df)
Output:
shape: (3, 3)
┌─────────┬─────┬────────┐
│ Name    │ Age │ Salary │
├─────────┼─────┼────────┤
│ Charlie │  35 │  70000 │
│ David   │  40 │  80000 │
│ Eve     │  45 │  90000 │
└─────────┴─────┴────────┘
Polars processes this faster than Pandas, even with millions of rows.
Step 4: Selecting Specific Columns
If you only need Name and Salary, you can select specific columns:
df_selected = df.select(["Name", "Salary"])
print(df_selected)
Output:
shape: (5, 2)
┌─────────┬────────┐
│ Name    │ Salary │
├─────────┼────────┤
│ Alice   │  50000 │
│ Bob     │  60000 │
│ Charlie │  70000 │
│ David   │  80000 │
│ Eve     │  90000 │
└─────────┴────────┘
Fast and efficient for large datasets!
Step 5: Sorting Data
Sorting a dataset in ascending order by salary:
df_sorted = df.sort("Salary")
print(df_sorted)
Output:
shape: (5, 3)
┌─────────┬─────┬────────┐
│ Name    │ Age │ Salary │
├─────────┼─────┼────────┤
│ Alice   │  25 │  50000 │
│ Bob     │  30 │  60000 │
│ Charlie │  35 │  70000 │
│ David   │  40 │  80000 │
│ Eve     │  45 │  90000 │
└─────────┴─────┴────────┘
Polars sorts big data faster than Pandas.
Step 6: Grouping and Aggregating Data
If you have duplicate age values and want to calculate the average salary per age, you can do:
df_grouped = df.groupby("Age").agg(pl.col("Salary").mean())
print(df_grouped)
Output:
shape: (5, 2)
┌─────┬────────┐
│ Age │ Salary │
├─────┼────────┤
│  25 │  50000 │
│  30 │  60000 │
│  35 │  70000 │
│  40 │  80000 │
│  45 │  90000 │
└─────┴────────┘
Polars makes grouping large datasets fast!
Step 7: Reading Large CSV Files
Polars is 10-100x faster than Pandas for reading big CSV files.
df = pl.read_csv("large_file.csv")
print(df)
Polars loads large files in seconds, while Pandas can take minutes!
Step 8: Why is Polars Better than Pandas?
| Feature | Polars | Pandas |
|---|---|---|
| Speed | 🚀 Very Fast | 🐢 Slow |
| Parallel Processing | ✅ Yes | ❌ No |
| Memory Usage | ✅ Low | ❌ High |
| Handles Big Data? | ✅ Yes | ❌ No |
| Lazy Execution | ✅ Yes | ❌ No |
Polars is the best choice for working with large datasets!
Datatable – High-Performance Data Processing
What is Datatable?
Datatable is a high-speed data processing library designed for handling large datasets efficiently. It is similar to Pandas but much faster when dealing with big data. Datatable is inspired by the data.table package in R and is optimized for speed and low memory usage.
If you work with millions or even billions of rows, Datatable will process them much faster than Pandas. It is built with multi-threading, which means it can use multiple CPU cores to speed up operations.
Step 1: Installing Datatable
First, install Datatable using pip:
pip install datatable
Now, you’re ready to use it in Python.
Step 2: Creating a Data Table
A Data Table is similar to a DataFrame in Pandas. Let’s create one using Datatable:
import datatable as dt

# Creating a table
df = dt.Frame({
    "Name": ["Alice", "Bob", "Charlie", "David", "Eve"],
    "Age": [25, 30, 35, 40, 45],
    "Salary": [50000, 60000, 70000, 80000, 90000]
})

print(df)
Output:
   | Name    Age   Salary
-- + -----  ---   ------
 0 | Alice   25   50000
 1 | Bob     30   60000
 2 | Charlie 35   70000
 3 | David   40   80000
 4 | Eve     45   90000
It looks like Pandas but runs much faster!
Step 3: Filtering Data (Selecting Rows Based on Conditions)
Let’s filter rows where Age > 30:
filtered_df = df[f.Age > 30, :]
print(filtered_df)
Output:
   | Name    Age   Salary
-- + -----  ---   ------
 0 | Charlie 35   70000
 1 | David   40   80000
 2 | Eve     45   90000
Datatable filters data much faster than Pandas, even for millions of rows!
Step 4: Selecting Specific Columns
To select only Name and Salary columns:
df_selected = df[:, ["Name", "Salary"]]
print(df_selected)
Output:
   | Name    Salary
-- + -----  ------
 0 | Alice   50000
 1 | Bob     60000
 2 | Charlie 70000
 3 | David   80000
 4 | Eve     90000
This is extremely fast and memory-efficient!
Step 5: Sorting Data
To sort data by Salary in descending order:
df_sorted = df[:, :, dt.sort(-f.Salary)]
print(df_sorted)
Output:
   | Name    Age   Salary
-- + -----  ---   ------
 0 | Eve     45   90000
 1 | David   40   80000
 2 | Charlie 35   70000
 3 | Bob     30   60000
 4 | Alice   25   50000
Sorting in Datatable is highly optimized for speed!
Step 6: Grouping and Aggregating Data
If we want to find the average salary by age, we can group the data like this:
df_grouped = df[:, dt.mean(f.Salary), by("Age")]
print(df_grouped)
Output:
   | Age   Salary
-- + ---   ------
 0 |  25   50000
 1 |  30   60000
 2 |  35   70000
 3 |  40   80000
 4 |  45   90000
Datatable processes grouped operations much faster than Pandas!
Step 7: Reading Large CSV Files
Datatable is much faster than Pandas when reading CSV files.
df = dt.fread("large_file.csv")
print(df)
Datatable reads large files in seconds, while Pandas might take minutes!
Comparison: Datatable vs. Pandas
| Feature | Datatable | Pandas |
|---|---|---|
| Speed | 🚀 Very Fast | 🐢 Slow |
| Memory Usage | ✅ Low | ❌ High |
| Handles Big Data? | ✅ Yes | ❌ No |
| Multi-threading? | ✅ Yes | ❌ No |
Datatable is perfect for processing massive datasets quickly!
Sweetviz – Automatic Data Exploration & Visualization
What is Sweetviz?
Sweetviz is a Python library for automated data exploration and visualization. Instead of writing long code to analyze datasets, Sweetviz generates interactive reports with just one command. It helps you quickly understand:
- Data distributions (e.g., how values are spread)
- Missing values (to spot issues in data)
- Correlations (to find relationships between columns)
- Comparisons between datasets (train vs. test data)
It is much faster and more detailed than manually inspecting data using Pandas.
Step 1: Installing Sweetviz
First, install Sweetviz using pip:
pip install sweetviz
Now, you’re ready to use it in Python!
Step 2: Importing and Loading Data
Let’s use the Titanic dataset as an example:
import sweetviz as sv
import pandas as pd

# Load dataset
df = pd.read_csv("https://raw.githubusercontent.com/datasciencedojo/datasets/master/titanic.csv")

# Show first few rows
df.head()
Step 3: Generating an Automated Report
With just one line of code, Sweetviz generates a full report:
report = sv.analyze(df)
report.show_html("titanic_report.html")
What Happens?
- Sweetviz analyzes all columns and detects patterns.
- It generates a detailed HTML report with charts, summaries, and insights.
- The report is saved as an interactive web page (
titanic_report.html).
Open the file in your browser to explore the data visually!
Step 4: Comparing Two Datasets
If you want to compare train and test datasets, use this:
train_df = df.sample(frac=0.8, random_state=42)  # 80% training data
test_df = df.drop(train_df.index)  # Remaining 20% as test data

# Generate comparison report
compare_report = sv.compare([train_df, "Train Data"], [test_df, "Test Data"])
compare_report.show_html("comparison_report.html")
What Happens?
- Sweetviz compares column distributions, missing values, and statistics.
- It highlights differences between train and test data.
- The comparison report is saved as
comparison_report.html.
This helps check for data leakage or imbalances before training a model!
Step 5: Understanding the Sweetviz Report
Sweetviz provides detailed visual insights, including:
Overview of the Dataset
- Total number of rows and columns
- Data types (numerical, categorical, etc.)
- Number of missing values
Column-Level Insights
For each column, Sweetviz shows:
- Histogram (for numeric columns)
- Bar chart (for categorical columns)
- Outliers and missing values
Correlation Analysis
- Detects strong relationships between columns
- Highlights potential predictive features
Target Variable Analysis
- Shows how each feature affects the target variable
- Useful for classification and regression tasks
Why Use Sweetviz Instead of Pandas?
| Feature | Sweetviz | Pandas |
|---|---|---|
| Visualization | ✅ Automatic Charts | ❌ Manual Code Needed |
| Data Summary | ✅ One-Click Insights | ❌ Requires Multiple Commands |
| Correlation Analysis | ✅ Built-In | ❌ Manual Calculation |
| Train/Test Comparison | ✅ Yes | ❌ No |
| Missing Value Detection | ✅ Automatic | ❌ Requires Custom Code |
Sweetviz is perfect for quick and easy data exploration!
Lux – Smart DataFrame Visualization
What is Lux?
Lux is a Python library that automatically generates visualizations when you work with Pandas DataFrames. Instead of manually creating plots with Matplotlib or Seaborn, Lux suggests relevant charts instantly based on your data.
Why Use Lux?
- Automates data visualization – No need to write long code for charts.
- Works with Pandas – Just install and use it with your existing workflows.
- Finds insights quickly – Detects trends, correlations, and distributions.
Step 1: Installing Lux
First, install Lux using pip:
pip install lux-api
Now, enable it inside a Jupyter Notebook:
import lux
import pandas as pd
Step 2: Loading Data and Using Lux
Let’s use the Titanic dataset as an example:
df = pd.read_csv("https://raw.githubusercontent.com/datasciencedojo/datasets/master/titanic.csv")

# Enable Lux to show automatic visualizations
df
What Happens?
- When you display
dfin a Jupyter Notebook, Lux generates visualizations automatically! - You’ll see suggested charts based on your data.
- Click the toggle button to switch between the table and visualizations.
Step 3: Customizing Insights
Lux is smart, but you can also guide it to focus on specific insights.
Example 1: Show Relationships Between Age and Fare
df.intent = ["Age", "Fare"]
df
Lux will generate scatter plots and other charts focusing on Age vs. Fare.
Example 2: Analyze Survival Rates
df.intent = ["Survived"]
df
Lux will automatically generate bar charts showing how different features impact survival.
Step 4: Exporting Visualizations
Want to save the charts? Convert Lux insights into Matplotlib or Altair plots:
chart = df.exported[0]  # Get the first suggested chart
chart
This allows further customization!
Why Use Lux Instead of Manual Plotting?
| Feature | Lux | Matplotlib/Seaborn |
|---|---|---|
| Automatic Charts | ✅ Yes | ❌ No |
| Works with Pandas | ✅ Yes | ✅ Yes |
| Finds Insights Instantly | ✅ Yes | ❌ No |
| Customization | ✅ Yes | ✅ Yes |
Lux saves time and makes exploring data effortless!
Conclusion: Which Library Should You Try First?
These 10 Python libraries for data science can speed up your workflow, improve efficiency, and help you handle large datasets effortlessly. Whether you’re working with big data, machine learning, or automation, these tools will save you time and boost your productivity.
Which library will you try first? Let us know in the comments!
FAQs
Q1: Which is the fastest Python library for big data?
Q2: What are some underrated Python libraries for data science?
Q3: Can these libraries replace Pandas?
External Resources
🔗 Kaggle – Free Datasets & Notebooks: https://www.kaggle.com/
🔗 Google Colab – Run Python in the Cloud: https://colab.research.google.com/
🔗 Scikit-Learn – Machine Learning Library: https://scikit-learn.org/stable/


")


Leave a Reply