Linear Algebra for Data Science: The Complete Guide [Part 1]
Introduction to Linear Algebra for Data Science
Linear algebra is important in data science. It provides the mathematical foundation for machine learning and artificial intelligence. It enables us to work with large datasets and transform raw data into meaningful insights. Without linear algebra, technologies like facial recognition, recommendation systems, and language processing would not be as effective.
This guide introduces the basics of linear algebra, starting with vectors and matrices—the core elements of this field. You’ll learn how to use them and why they’re so important in data science.
We’ll also explore how tools like NumPy and TensorFlow rely on linear algebra to handle data efficiently. By mastering these concepts, you’ll be better prepared to solve complex problems and optimize your machine learning models.
Linear Algebra for Data Science: The Heart of AI and Machine Learning
If you’re starting out in data science, you’ve probably come across the term linear algebra a lot. It might sound tricky at first, but it’s actually the foundation for many things in this field. From Netflix’s recommendation systems to Facebook’s facial recognition and even tools like chatbots using natural language processing (NLP), linear algebra is the engine driving these technologies.
Let’s simplify things and explore why linear algebra is so important for data science and how it’s applied in real-world scenarios.
Why Linear Algebra Matters in Data Science
Linear algebra, in simple terms, deals with matrices and vectors. These are tools we use to store and work with data.
- Vectors are like lists of numbers—they can represent a row or a column of data.
- Matrices are grids or tables made up of multiple rows and columns of numbers.
Together, they help us organize and process data efficiently.
So, why do we need them?
- When you have a lot of data, you need a way to store and organize it. Matrices help with this by keeping data in a neat and easy-to-process structure.
- In machine learning, you sometimes need to change your data, like making it bigger or smaller, or rotating it. Matrices help make those changes, so the data can be used by the algorithm.
- Machine learning models, like linear regression or neural networks, use matrices to find patterns in the data. They “learn” from the data by doing things like multiplying matrices, which helps them make better predictions.
Real-World Uses of Linear Algebra in Data Science
Let’s look at how linear algebra for data science helps in real-world applications:
- Recommendation Systems: Ever wondered how Netflix knows what movies or shows you’d like? It looks at what you’ve watched before and compares it to what millions of other users like. It turns your preferences into numbers (vectors), stores them in matrices, and uses math to predict what you might enjoy next based on similar users.
- Facial Recognition: When Facebook suggests tagging someone in a photo, it’s not magic—it’s math! The system turns images of faces into numbers (vectors). By comparing these numbers, it can find the right person and match their face to their profile.
- Natural Language Processing (NLP): Linear algebra helps machines understand language. Words are turned into numbers (vectors), and by comparing these numbers, systems like Google Translate can figure out the meaning of a sentence and translate it into another language.
How Machine Learning and AI Rely on Linear Algebra
Many machine learning algorithms depend on linear algebra to process data and learn patterns. Here are a few examples:
- Linear Regression: This is one of the simplest algorithms in machine learning. It finds the relationship between input and output by solving equations using matrices. Here’s a little Python code to show how NumPy handles matrix multiplication:
import numpy as np

# Two example matrices
matrix1 = np.array([[1, 2], [3, 4]])
matrix2 = np.array([[5, 6], [7, 8]])

# Matrix multiplication
result = np.dot(matrix1, matrix2)
print(result)
Output:
[[19 22]
[43 50]]
In this code, we’re multiplying two matrices, and the result is a new matrix. This type of operation is what happens behind the scenes in many algorithms.
- Principal Component Analysis (PCA): This technique is used to reduce the complexity of data. When you have too many features (or columns) in a dataset, PCA helps compress the data while still keeping the important parts. All of this is done with matrix transformations.
- Neural Networks: Neural networks, which are used for deep learning, are built on layers of matrices. The weights and biases in the network are stored as matrices. During training, the network adjusts these matrices to minimize errors, and that’s how it learns to make better predictions.
Tools That Rely on Linear Algebra
A few tools that data scientists use every day are built on top of linear algebra:
- NumPy: This is a Python library that makes it easy to work with matrices and vectors. It has functions for matrix multiplication, dot products, and much more.
- TensorFlow: If you’re into deep learning, you’ll eventually work with TensorFlow. It’s a library that builds and trains neural networks using matrices to store and adjust data as it learns.
Why Linear Algebra is important for Data Science
Without linear algebra, modern data science and machine learning wouldn’t exist. Here’s why:
- Efficient Data Handling: Matrices help computers handle large amounts of data quickly. If we had to process each data point one by one, it would take forever! But with matrices, data can be processed all at once, making things much faster.
- Data Transformations: In machine learning, changing the data is an important step. For example, when you compress an image or shrink text for NLP tasks, matrices make these changes simple and efficient.
Key Concepts to Remember
Here’s a quick summary of the most important concepts:
| Concept | Explanation | Example |
|---|---|---|
| Vector | A list of numbers representing data points | [1,2,3] |
| Matrix | A grid of numbers holding multiple vectors | [[1 2] [3 4]] |
| Dot Product | A multiplication of two vectors, resulting in a single number | [1,2]⋅[3,4]=1(3)+2(4)=11 |
| Matrix Multiplication | A multiplication of two matrices, producing a new matrix | Python code above shows this example |
Key Concepts of Linear Algebra for Data Science
What Are Vectors in Data Science?
In data science and machine learning, you will often encounter vectors as a fundamental concept. But what exactly are they, and why are they so important? Understanding vectors is crucial because they serve as building blocks for everything, from basic data manipulation to complex machine learning algorithms.
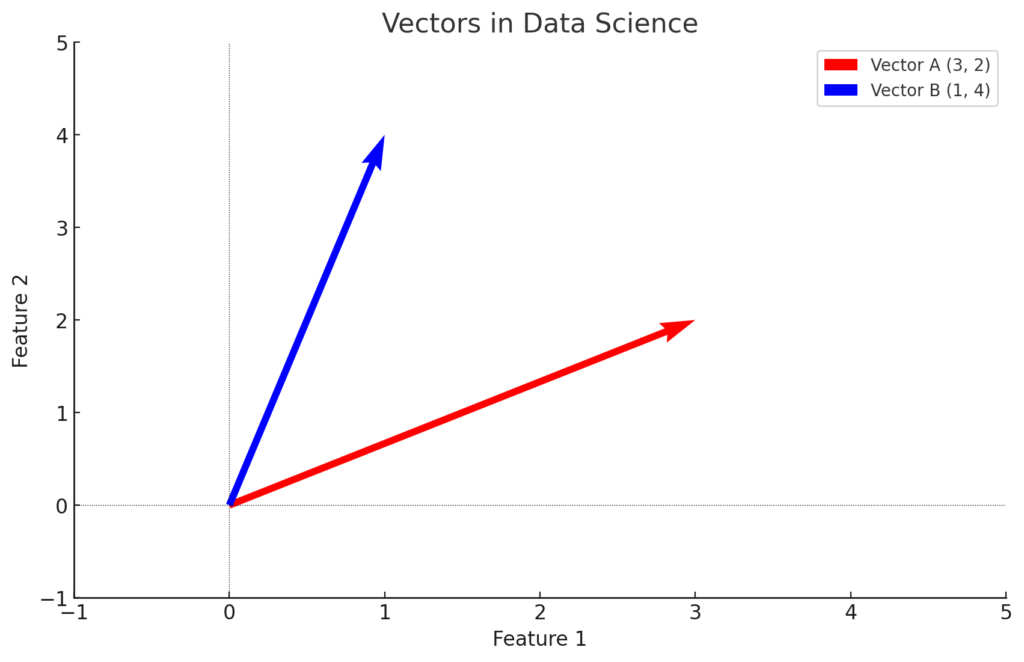
In this article, we’ll go through:
- A simple definition of vectors in data science.
- How vectors are used in machine learning.
- Key operations on vectors and why they matter.
We’ll keep it easy to understand and use real-world examples to help you grasp the concept.
Definition of Vectors
A vector is a one-dimensional array of numbers. In data science, vectors are used to represent data points. For example, if you have three features—age, height, and weight—you can represent them as a vector.
A simple vector example might look like this:
v=[28,175,70]
Here, 28 is age, 175 is height in cm, and 70 is weight in kg. Vectors can have any number of elements, depending on how many features you are working with.
How Vectors Are Used in Machine Learning
Machine learning models heavily rely on vectors. In fact, almost everything in machine learning starts with vectors. Here’s how:
- Input Feature Vectors: When training a machine learning model, the input data (features) is usually represented as a vector. Each feature is a component of the vector. For example, in a model predicting house prices, the features might be square footage, number of bedrooms, and location, all combined into a single vector.
- Weights and Biases: In models like linear regression or neural networks, the parameters (weights and biases) that the model learns during training are stored in vectors. As the model trains, these vectors are updated to help the model make more accurate predictions.
- Prediction Outputs: After the input passes through the model, the output is often a vector. For example, in multi-class classification, the model will output a vector of probabilities, where each value represents the likelihood of a specific class.
Example in Python
Here’s a quick example of an input feature vector in Python:
import numpy as np

# A vector representing age, height, and weight
input_vector = np.array([28, 175, 70])

print(input_vector)
In this code, we use NumPy to create a simple vector. The model will take this as input and use it to make predictions.
Operations on Vectors
Now, let’s move to some important operations you can perform on vectors. These operations are important for transforming and manipulating data.
1. Vector Addition
When you add two vectors, you simply add their corresponding components. This operation is used when combining features or data points.
Example:
a=[1,2,3]
b=[4,5,6]
Adding these two vectors results in:
a+b=[1+4,2+5,3+6]=[5,7,9]
In data science, this operation might be used to combine data points or modify features.
2. Scalar Multiplication
When you multiply a vector by a scalar (a single number), each number in the vector is multiplied by that scalar. This is commonly used in machine learning to adjust the scale of data, making it easier for models to process.
Example:
v=[1,2,3]
v×2=[1×2,2×2,3×2]=[2,4,6]
Scalar multiplication is particularly useful when scaling features in data preprocessing.
3. Dot Product
The dot product is a special operation where you multiply corresponding elements of two vectors and then sum the results. It’s crucial for many machine learning algorithms, including linear regression.
Example:
a=[1,2,3]
b=[4,5,6]
a⋅b=1×4+2×5+3×6=4+10+18=32
The dot product helps determine the similarity between two vectors and is a key operation in neural networks.
Why Vectors Matter in Data Science
So why are vectors so crucial in data science? Here’s a summary of their importance:
- Efficient Data Representation: Vectors provide an efficient way to store and represent data. Instead of handling individual data points separately, you can manage them all together in a single vector.
- Data Manipulation: Operations like addition and scalar multiplication help transform and scale your data, making it easier to prepare for machine learning algorithms.
- Foundational in Algorithms: Vectors and their operations are crucial for many machine learning algorithms, including linear regression and deep learning.
Tools for Working with Vectors in Data Science
Several tools make working with vectors easier in data science:
- NumPy: This is the main Python library used for creating and working with vectors. It has built-in functions for vector operations like addition, scalar multiplication, and dot products.
- TensorFlow: This widely used library for deep learning models depends on vectors (referred to as tensors in this case). It offers tools for building and training neural networks that work with vector data.
Understanding Matrices in Data Science
What is a Matrix in Data Science?
In data science, you often deal with large datasets, and one of the most effective ways to organize this information is through matrices. Understanding matrices is important for tasks like data manipulation and for building and training machine learning models.
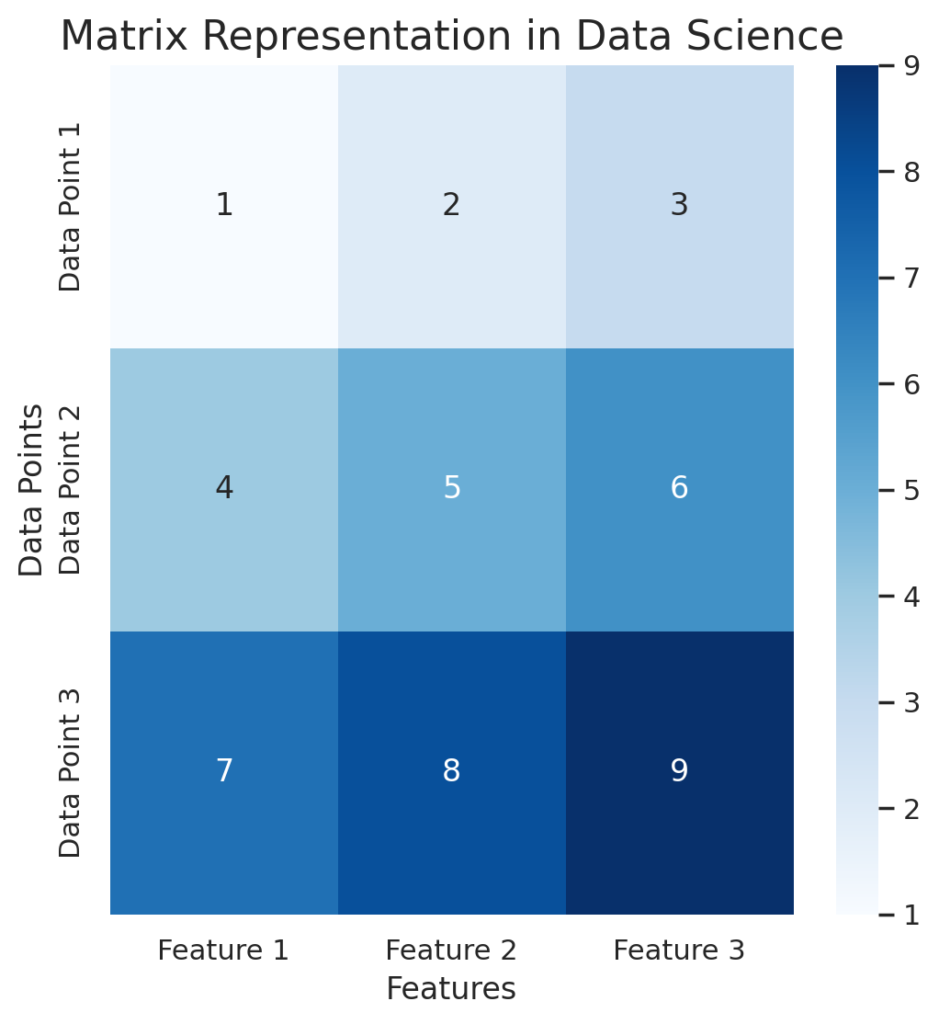
In this guide, we’ll break down:
- What a matrix is.
- How matrices represent datasets in machine learning.
- Examples of matrices in action.
We’ll keep things simple and relatable, making it easy to understand even if you’re just starting with Linear Algebra for Data Science.
Definition of a Matrix
A matrix is a two-dimensional array of numbers arranged in rows and columns. In simple terms, it’s like a grid where data is organized neatly. You might already be familiar with spreadsheets or tables, and matrices follow a similar structure.
For example, this is a matrix with 3 rows and 3 columns:
[[1 2 3]
[4 5 6]
[7 8 9]]
In data science, the rows often represent data points (individual entries), and the columns represent features (attributes of each data point).
Matrix Representation of Data
Matrices play a crucial role in machine learning because they make it possible to organize, store, and manipulate large datasets efficiently. When working with data, you typically have multiple rows (data points) and columns (features).
For instance, if you were analyzing data for a house price prediction model, the matrix might look like this:
| Size (sqft) | Bedrooms | Price ($) |
|---|---|---|
| 1200 | 3 | 250,000 |
| 1500 | 4 | 300,000 |
| 1700 | 4 | 350,000 |
This table can be converted into a matrix:

Here’s what’s happening:
- Rows (horizontal) represent individual houses (data points).
- Columns (vertical) represent attributes such as size, bedrooms, and price.
By using a matrix, you can efficiently store large datasets and perform operations on them using linear algebra techniques. This is especially important when training machine learning models, where operations like matrix multiplication play a huge role.
How Matrices are Used in Machine Learning
In machine learning, matrices make it possible to handle large datasets. They allow algorithms to perform complex calculations efficiently. Here’s how matrices are commonly used:
1. Storing Datasets
As shown earlier, datasets are often represented as matrices, where each row is a data point, and each column is a feature. This makes it easy to manipulate and analyze the data using linear algebra tools.
2. Matrix Multiplication in Neural Networks
When training a neural network, matrices are used to handle input data, weights, and biases. During the forward propagation step, the input data is multiplied by the weight matrix to compute predictions.
For example, consider a simple neural network with an input matrix X and a weight matrix W:
Y=X×W
Here, the matrix multiplication allows us to process the data through the network efficiently. The output matrix Y contains the predictions.
3. Transformation of Data
In many machine learning tasks, you’ll need to perform transformations on data, such as scaling, rotating, or shifting the dataset. Matrices are used to represent these transformations and apply them to the entire dataset in a single operation.
Matrix Operations in Data Science
Working with matrices in data science involves several key operations, each of which is important for building machine learning models. Here are some common matrix operations:
1. Matrix Addition
In matrix addition, corresponding elements of two matrices are added together. This operation is useful when combining datasets or modifying features.
Example:
If you have two matrices:
Matrix Multiplication in Data Science
Matrix multiplication plays a huge role in machine learning algorithms. It’s the foundation for many data transformations and model training processes. When we multiply two matrices, we’re combining the rows of one matrix with the columns of another to create a new matrix. This operation is central in many algorithms like linear regression, Principal Component Analysis (PCA), and neural networks.
How Matrix Multiplication Works
Matrix multiplication is not the same as element-wise multiplication (where you multiply corresponding elements of two matrices). Instead, it’s about combining rows and columns.
Here’s an example of two matrices A and B being multiplied:
Example:
Let’s say you have two matrices:

Matrix multiplication helps models process large amounts of data quickly.
Importance in Data Science
In linear regression, the model finds the best-fit line by minimizing the difference between actual and predicted values. This involves multiplying the input data matrix by the weight matrix to make predictions.
In neural networks, matrix multiplication occurs at each layer. The input data is transformed using weight matrices, allowing the model to learn patterns and make predictions.
Code Example
Let’s take a look at how matrix multiplication is implemented using Python and NumPy:
import numpy as np

A = np.array([[1, 2], [3, 4]])
B = np.array([[5, 6], [7, 8]])

# Matrix multiplication
C = np.dot(A, B)
print(C)
Output:
[[19 22]
 [43 50]]
This simple code multiplies two matrices, just like the earlier example.
3. Matrix Transposition in Data Science
Matrix transposition is a basic but incredibly useful operation, especially in Linear Algebra for Data Science. Transposing a matrix means turning it sideways. You swap the rows with the columns. This operation is helpful when you need to organize data in a different way for calculations, like when working with covariance matrices.
How Matrix Transposition Works
Let’s take a simple 2×2 matrix A:
For example:

By swapping the rows with the columns, we get the transpose. This operation is often necessary in algorithms that require the data in a different orientation.
Applications in Data Science
- Covariance matrices: When you calculate the covariance matrix of a dataset, matrix transposition is used to reorient the data.
- Dot products: In some calculations, such as dot products, the transpose of a matrix is required to make the multiplication valid.
4. Determinants and Inverses of Matrices
Determinants and matrix inverses might seem tricky, but they are important concepts in Linear Algebra for Data Science. The determinant helps you understand the “size” or “scaling factor” of a matrix, while the inverse is used to undo a matrix’s effect, much like reversing a process.
These concepts are important for tasks like solving systems of equations, optimizing machine learning models, and understanding the behavior of matrices in different calculations.
Determinants
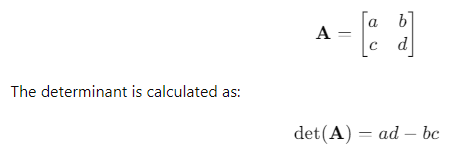
The determinant of a matrix is a scalar value that can tell us things like whether a matrix is invertible (i.e., whether it has an inverse). If a matrix’s determinant is zero, it means that the matrix doesn’t have an inverse, and the data might be dependent (i.e., there is no unique solution for a system of equations).
For a 2×2 matrix:
Inverses of Matrices
The inverse of a matrix is similar to the reciprocal of a number. When you multiply a matrix by its inverse, you get the identity matrix, which is like multiplying by 1.
In machine learning, matrix inversion is useful for solving systems of equations. For example, in linear regression, it helps find the best-fit line by solving for the weights in the model.
For example, in linear regression, to calculate the weights that minimize the error, we solve:

Code Example
Let’s see how we can calculate the determinant and inverse of a matrix using NumPy:
import numpy as np

A = np.array([[1, 2], [3, 4]])

# Determinant of A
det_A = np.linalg.det(A)
print("Determinant:", det_A)

# Inverse of A
inv_A = np.linalg.inv(A)
print("Inverse:\n", inv_A)
Output:
Determinant: -2.0
Inverse:
 [[-2.   1. ]
 [ 1.5 -0.5]]
Why Matrices Are Important in Data Science
- Efficient Data Handling: Matrices allow you to store and process large datasets efficiently. With matrices, you can perform mathematical operations on the entire dataset at once, which speeds up analysis and training.
- Data Transformation: In machine learning, matrices are used for scaling, normalizing, and transforming data. These transformations are essential for improving model accuracy.
- Core to Algorithms: Most machine learning algorithms rely on matrix operations. From simple linear regression to complex deep learning models, matrices power the computations behind the scenes.
Tools for Working with Matrices in Data Science
Working with matrices in data science is made easier with various tools:
- NumPy: A powerful library for matrix operations in Python. It allows you to perform matrix multiplication, addition, and other operations with ease.
- Pandas: This library is widely used for data manipulation and analysis, allowing you to store datasets in DataFrames, which are essentially matrices.
- TensorFlow: In deep learning, matrices (often called tensors) are crucial for building and training neural networks. TensorFlow helps manage these complex operations efficiently.
Types of Matrices for Data Science
In data science, it’s important to understand the different types of matrices. Each type has its own purpose and can make tasks like data transformation, representation, and modeling easier. If you’re studying Linear Algebra for Data Science, getting to know these matrix types will greatly improve your analytical abilities.
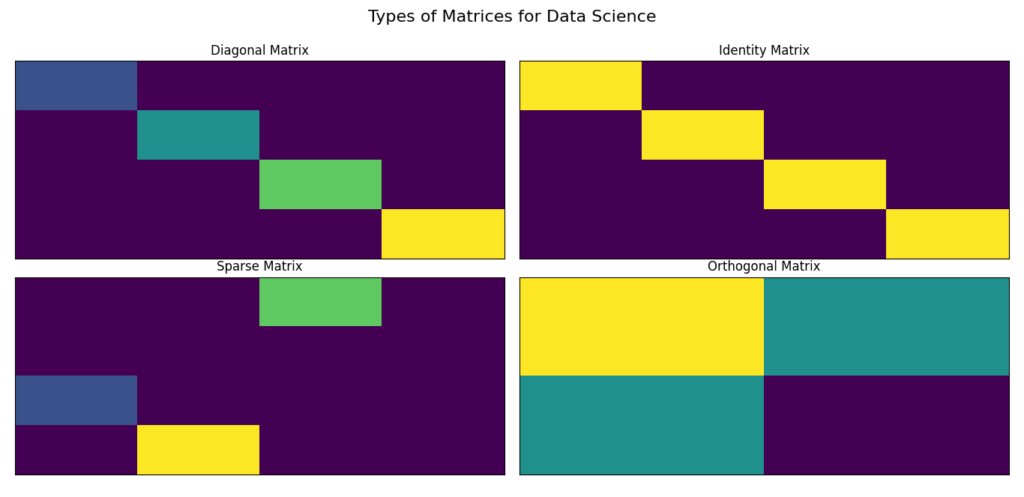
Let’s explore several key types of matrices, their significance in data science, and real-world applications.
Diagonal Matrix
In linear algebra, a diagonal matrix is a matrix where all the elements outside the main diagonal are zero. The main diagonal (from top-left to bottom-right) can have any values, but the rest are zeros. This simple structure makes certain operations easier and faster, making diagonal matrices very useful in data science for various tasks.
A diagonal matrix can be represented as follows:

Here, d1, d2, and d3 are the non-zero elements found along the diagonal, while all other elements are zeros. This structure is not only neat but also significantly influences calculations.
Importance of Diagonal Matrices in Data Science
Diagonal matrices hold several advantages, particularly in the realm of data science:
- Simplification of Operations: When performing matrix operations, diagonal matrices can make calculations faster and simpler. For example, when multiplying a diagonal matrix with another matrix, only the diagonal elements contribute to the result, drastically reducing computation time.
- Scaling: Diagonal matrices are often used to represent scaling operations. If a diagonal matrix is multiplied by a data matrix, each feature can be scaled by different factors. This is particularly useful in preparing data for analysis.
- Representation of Variance: In techniques like Principal Component Analysis (PCA), diagonal matrices can effectively represent the variances of different dimensions. This helps in understanding how much variance each feature contributes to the overall data.
Example in Data Science
Let’s consider a practical example: a recommendation system. In such systems, a diagonal matrix could represent the weights of features for different users. This approach allows each user’s preferences to be easily scaled based on their ratings, enhancing the overall accuracy of recommendations.
Python Code Example
To illustrate how to create a diagonal matrix in Python, we can use the NumPy library. Here’s a simple code snippet:
import numpy as np

# Example of a diagonal matrix
D = np.diag([1, 2, 3])
print(D)
Output:
[[1 0 0]
 [0 2 0]
 [0 0 3]]
In this example, the matrix DDD consists of three diagonal elements: 1, 2, and 3. The zeros surrounding these values confirm the defining characteristic of a diagonal matrix.
Key Characteristics of Diagonal Matrices
- Square Shape: Diagonal matrices are always square, meaning they have the same number of rows and columns.
- Efficient Computation: Many mathematical operations, such as addition or multiplication, can be performed quickly due to the presence of zeros in non-diagonal positions.
- Eigenvalues: The diagonal elements represent the eigenvalues of the matrix, providing insight into the matrix’s properties.
Benefits of Using Diagonal Matrices
The use of diagonal matrices can enhance various aspects of data analysis, including:
- Performance: Operations involving diagonal matrices tend to run faster because only the diagonal elements are active during calculations.
- Clarity: Representing data in a diagonal format can simplify visualizations and interpretations, making patterns easier to identify.
- Customization: Different scaling factors can be applied to each feature, allowing for a tailored approach to data analysis.
Incorporating diagonal matrices into your understanding of linear algebra for data science can lead to more efficient data processing and analysis. Their unique properties make them essential tools in various algorithms and methods. As you continue to explore linear algebra, remember that diagonal matrices not only simplify calculations but also offer a deeper understanding of data relationships.
Identity Matrix
An identity matrix is a special type of square matrix in linear algebra. It has a unique property: all the diagonal elements are equal to 1, while all off-diagonal elements are 0. This structure is fundamental in various mathematical computations, making it important for anyone studying linear algebra for data science.
An identity matrix can be represented as follows for a 3×3 matrix:

Importance of the Identity Matrix
The identity matrix plays a crucial role in many areas of data science. Its importance can be broken down into several key points:
- Multiplicative Identity: Just like the number 1 is the multiplicative identity for real numbers (e.g., 1×a=a), the identity matrix serves as the multiplicative identity for matrices. When any matrix A is multiplied by the identity matrix III, the original matrix A remains unchanged:
A×I=A
- Inversion: The identity matrix is closely related to matrix inversion. When a matrix A is multiplied by its inverse A^-1, the result is the identity matrix:
A×A^−1=I
- Solving Systems of Equations: In linear regression and other machine learning algorithms, identity matrices are used to solve systems of equations. The identity matrix simplifies computations, making it easier to work with various algorithms.
Practical Example of the Identity Matrix in Data Science
Let’s say you are working with a dataset where you need to apply transformations while maintaining the original data structure. In this scenario, the identity matrix can be used to achieve that. For instance, when applying a linear transformation to a dataset, multiplying by the identity matrix ensures that some dimensions are unaffected.
Python Code Example
To demonstrate the identity matrix in Python, we can use the NumPy library. Here’s a simple code snippet that creates an identity matrix:
I = np.eye(3)
print(I)
Output:
[[1. 0. 0.]
 [0. 1. 0.]
 [0. 0. 1.]]
In this example, the np.eye(3) function generates a 3×3 identity matrix. The output confirms that the diagonal elements are 1, while the rest are 0.
Applications of the Identity Matrix
The identity matrix finds its application in various domains, particularly in data science. Here are some key applications:
- Linear Transformations: In computer graphics and data transformations, identity matrices are used to ensure that certain transformations do not alter specific features.
- Machine Learning Algorithms: In algorithms such as linear regression, identity matrices facilitate the calculation of coefficients without affecting the input data.
- Eigenvalue Problems: Identity matrices play a significant role in finding eigenvalues and eigenvectors, which are crucial for techniques like PCA (Principal Component Analysis).
Benefits of Understanding the Identity Matrix
Gaining a solid understanding of the identity matrix provides numerous benefits:
- Enhanced Calculation Skills: Familiarity with the identity matrix can lead to quicker and more efficient calculations in matrix algebra.
- Better Algorithm Implementation: Understanding the role of the identity matrix in algorithms can improve the implementation of machine learning models.
- Clearer Data Insights: Recognizing how the identity matrix operates can lead to clearer insights when analyzing data transformations.
The identity matrix is a fundamental concept in linear algebra for data science. Its unique properties and applications make it an essential tool for various mathematical operations. By understanding the identity matrix, data scientists can improve their analytical skills and apply these concepts effectively in their work.
Key Takeaways:
- The identity matrix has diagonal elements equal to 1 and off-diagonal elements equal to 0.
- It acts as the multiplicative identity in matrix algebra.
- Understanding the identity matrix enhances skills in solving systems of equations and implementing machine learning algorithms.
Sparse Matrix
What is a Sparse Matrix?
A sparse matrix is a matrix where most of the elements are zero. In data science, sparse matrices are ideal for handling data with only a few significant values. They often appear in areas like natural language processing, recommender systems, and image processing.
For example, imagine a matrix showing user ratings for products. If most users haven’t rated many products, the matrix will have mostly zeros. Sparse matrices are crucial for efficiently storing and processing such data in linear algebra for data science.
Characteristics of Sparse Matrices
Sparse matrices have distinct characteristics that differentiate them from dense matrices. Here are some key points:
- Storage Efficiency: Sparse matrices can be stored more efficiently than dense matrices. Instead of storing all elements, only the non-zero elements and their positions are stored. This leads to significant memory savings.
- Computational Efficiency: Operations on sparse matrices are often faster. Specialized algorithms can take advantage of the sparsity, reducing the amount of computation needed.
- Applications in Data Science: Sparse matrices are widely used in various data science applications, including:
- Text data representation (e.g., bag-of-words models)
- User-item interactions in recommendation systems
- Image representation, where only a few pixels are significant
Example of a Sparse Matrix
Let’s consider a simple example of a sparse matrix:

In this 3×3 matrix, only two elements (3 and 5) are non-zero, while the rest are zeros. This matrix can be represented more efficiently by storing only the non-zero elements along with their positions.
Why Use Sparse Matrices?
Using sparse matrices in data science can provide several benefits:
- Reduced Memory Usage: By only storing non-zero elements, the amount of memory required can be significantly reduced, especially for large datasets.
- Faster Computation: Algorithms designed for sparse matrices can perform operations more quickly by ignoring the zero elements.
- Facilitation of Large-Scale Problems: Sparse matrices make it possible to handle large-scale problems, such as those encountered in machine learning and data mining.
Working with Sparse Matrices in Python
Python provides libraries such as SciPy, which include efficient ways to work with sparse matrices. Here’s a simple example demonstrating how to create and manipulate a sparse matrix using the SciPy library:
import numpy as np
from scipy.sparse import csr_matrix

# Creating a dense matrix
dense_matrix = np.array([[0, 0, 3],
                          [0, 0, 0],
                          [5, 0, 0]])

# Creating a sparse matrix using Compressed Sparse Row format
sparse_matrix = csr_matrix(dense_matrix)

# Displaying the sparse matrix
print(sparse_matrix)
Output:
  (0, 2)	3
  (2, 0)	5
In this code snippet, the csr_matrix function from the SciPy library is used to create a sparse matrix in Compressed Sparse Row format. The output displays the non-zero elements along with their positions, illustrating the efficiency of storage.
Applications of Sparse Matrices in Data Science
Sparse matrices are employed in various data science applications. Here are some practical examples:
- Natural Language Processing: In text analysis, sparse matrices can represent term-document matrices, where each entry indicates the presence or absence of a term in a document.
- Recommendation Systems: Sparse matrices can represent user-item interaction matrices, allowing systems to provide personalized recommendations based on limited user feedback.
- Image Processing: In image compression, sparse matrices can represent images where most pixels are zero (black) and only a few pixels have values (colored).
Example in Recommender Systems
Imagine a user-item rating matrix for a movie recommendation system. Most users won’t rate all movies, leading to a sparse matrix. Instead of storing all ratings, only the non-zero ratings will be saved.
from scipy.sparse import csr_matrix

# Create a sparse matrix (3x3)
sparse_matrix = csr_matrix([[1, 0, 0], [0, 0, 3], [4, 0, 0]])
print(sparse_matrix)
Output:
  (0, 0)	1
  (1, 2)	3
  (2, 0)	4
Orthogonal Matrices and Their Role in Data Transformation
In the world of linear algebra for data science, one of the most important concepts is that of orthogonal matrices. These matrices have special properties that make them essential in various data transformation tasks. Understanding orthogonal matrices can greatly enhance your skills in data science, especially when dealing with complex data transformations and algorithms.
What is an Orthogonal Matrix?
An orthogonal matrix is a square matrix whose rows and columns are orthogonal unit vectors. In simpler terms, this means that:
- Dot Product: The dot product of any two different rows (or columns) is zero.
- Length: Each row (or column) has a length of one.
Mathematically, a matrix A is orthogonal if it satisfies the following condition:

Visualizing Orthogonal Matrices
To visualize what orthogonality means, consider a simple example with a 2D space. Imagine two vectors v1 and v2:
- v1=[1,0]
- v2=[0,1]
These vectors are orthogonal because they are perpendicular to each other. When represented as a matrix:
A=[[1 0]
[0 1]]
This is the identity matrix, which is also an orthogonal matrix. The beauty of orthogonal matrices lies in their ability to rotate and reflect data without distorting it.
Importance of Orthogonal Matrices in Data Science
Orthogonal matrices play a crucial role in data science for several reasons:
- Data Transformation: They can be used to transform data while preserving its structure. This is especially important in techniques such as Principal Component Analysis (PCA), where data is projected onto orthogonal axes.
- Numerical Stability: Operations involving orthogonal matrices are often more numerically stable than those involving arbitrary matrices. This stability is vital when performing computations in high-dimensional spaces.
- Reducing Overfitting: In machine learning, orthogonal transformations can help in feature selection and dimensionality reduction, which can lead to better models by reducing overfitting.
Example of an Orthogonal Matrix
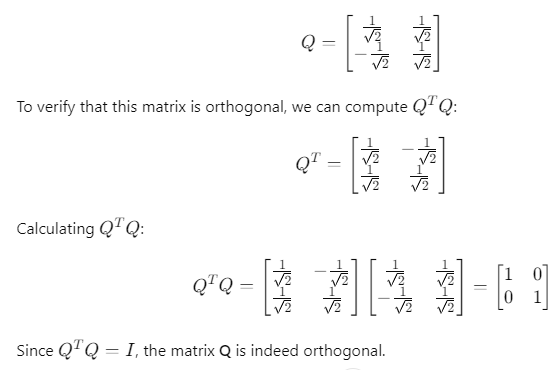
Consider the following orthogonal matrix:
Applications of Orthogonal Matrices in Data Science
Orthogonal matrices are applied in various areas of data science, including:
- Principal Component Analysis (PCA): PCA uses orthogonal transformations to reduce dimensionality while retaining most of the variance in the dataset. This is crucial for visualizing and interpreting high-dimensional data.
- QR Decomposition: This technique is used to solve linear systems and least squares problems. QR decomposition involves decomposing a matrix into an orthogonal matrix and an upper triangular matrix, making calculations simpler and more efficient.
- Machine Learning Algorithms: Many algorithms, such as Support Vector Machines (SVM) and Neural Networks, use orthogonal transformations to optimize performance and reduce overfitting.
Code Example: Orthogonal Matrix in Python
Here’s a simple example using Python to create an orthogonal matrix and verify its properties:
import numpy as np

# Define an orthogonal matrix
Q = np.array([[1/np.sqrt(2), 1/np.sqrt(2)],
              [-1/np.sqrt(2), 1/np.sqrt(2)]])

# Calculate the transpose
Q_transpose = Q.T

# Verify orthogonality
orthogonality_check = np.allclose(Q_transpose @ Q, np.eye(2))
print("Is Q an orthogonal matrix?", orthogonality_check)
Output:
Is Q an orthogonal matrix? True
In this code snippet, the orthogonality of matrix Q is confirmed by checking if the product of Q^T and Q results in the identity matrix.
Orthogonal matrices are a vital concept in linear algebra for data science. Their unique properties enable efficient data transformations, enhance numerical stability, and play a significant role in various applications. By understanding and leveraging orthogonal matrices, data scientists can improve their analysis and modeling techniques.
Example in Dimensionality Reduction
In PCA, the data is transformed into a new coordinate system. The axes (principal components) are chosen to be orthogonal, ensuring that each component captures as much variance as possible.
# Create an orthogonal matrix using NumPy
Q, R = np.linalg.qr(np.random.rand(3, 3))  # QR decomposition
print("Orthogonal Matrix Q:\n", Q)
Output (example):
Orthogonal Matrix Q:
 [[-0.5052786  -0.73974347 -0.44250455]
 [-0.68386848  0.05971564  0.7281658 ]
 [-0.52447045  0.67079318 -0.52696886]]
Summary of Matrix Types in Data Science
Understanding these types of matrices is essential for effective data manipulation and analysis. Here’s a quick summary:
| Matrix Type | Characteristics | Applications |
|---|---|---|
| Diagonal Matrix | Non-zero elements only on the diagonal. | Simplifies calculations, scaling features. |
| Identity Matrix | Diagonal elements are all 1. | Neutral element in multiplication, initialization. |
| Sparse Matrix | Most elements are zero. | Efficient storage in large datasets, recommender systems. |
| Orthogonal Matrix | Rows and columns are orthonormal vectors. | Preserves lengths in transformations, used in PCA. |
Eigenvectors and Eigenvalues: Power of Linear Transformations
What are Eigenvectors and Eigenvalues in Data Science?
Understanding eigenvectors and eigenvalues is crucial for uncovering patterns and simplifying complex data. While these concepts may seem intimidating at first, breaking them down into simple terms makes them easier to grasp. This article will help you understand what eigenvectors and eigenvalues are, how they work, and their importance in data analysis. If you are diving into Linear Algebra for Data Science, this topic is important!
Understanding Eigenvectors and Eigenvalues
Eigenvectors and eigenvalues are mathematical concepts that come from linear algebra. They are used extensively in data science, particularly in areas such as Principal Component Analysis (PCA), which is a technique for dimensionality reduction.
What are Eigenvectors?
An eigenvector is a special kind of vector that doesn’t change its direction after a transformation by a matrix. When a matrix acts on an eigenvector, the result is just the same vector scaled by a number, called the eigenvalue.
Mathematically, this can be represented as:
Av=λv
Here:
- A is a square matrix.
- v is the eigenvector.
- λ is the eigenvalue associated with that eigenvector.
What are Eigenvalues?
An eigenvalue is the scalar that represents how much the eigenvector is stretched or shrunk during the transformation. Essentially, it tells us whether the transformation expands or contracts the eigenvector.
In simpler terms, if you visualize the transformation of data in a 2D space, the eigenvectors point in the directions of maximum variance, while the eigenvalues tell you how much variance exists in those directions.
The Role of Eigenvectors and Eigenvalues in Finding Patterns
Eigenvectors and eigenvalues play a significant role in identifying patterns within data. They are particularly useful in various applications:
- Dimensionality Reduction: In techniques like PCA, eigenvectors help identify the most important features in a dataset. By focusing on the directions of maximum variance, data scientists can reduce the number of dimensions while retaining essential information.
- Image Compression: In image processing, eigenvectors are used to represent images in a lower-dimensional space. This helps in compressing images without losing significant quality.
- Clustering: Eigenvectors can also be used to enhance clustering algorithms, allowing data scientists to identify groupings or clusters more effectively.
Visualizing Eigenvectors and Eigenvalues
To better understand these concepts, let’s consider an example. Imagine a dataset represented in a 2D space. After applying a transformation (a matrix), the data points might change position.
- The eigenvectors will indicate the directions along which the data points are aligned.
- The corresponding eigenvalues will show how much the data points stretch or compress along those directions.
Here’s a simple visualization:
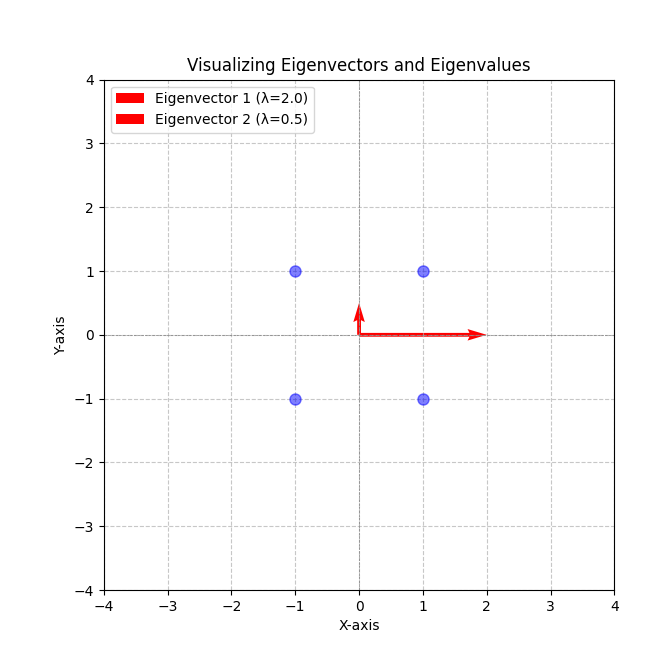
Here’s a visualization of eigenvectors and eigenvalues in a 2D space.
- The blue points represent original data points before transformation.
- The red arrows indicate the directions of the eigenvectors, with their lengths corresponding to the eigenvalues. The length of each arrow shows how much the data points stretch (for eigenvalue > 1) or compress (for eigenvalue < 1) along those directions.
This diagram helps illustrate how eigenvectors and eigenvalues relate to the transformation of data in a 2D space!
Example in Python
Let’s look at a practical example to solidify our understanding. Consider a small dataset represented as a matrix. We can compute the eigenvectors and eigenvalues using Python’s NumPy library.
import numpy as np

# Example matrix
A = np.array([[2, 1],
              [1, 2]])

# Compute eigenvalues and eigenvectors
eigenvalues, eigenvectors = np.linalg.eig(A)

print("Eigenvalues:", eigenvalues)
print("Eigenvectors:\n", eigenvectors)
When you run this code, you might see output like this:
Eigenvalues: [3. 1.]
Eigenvectors:
 [[ 0.70710678 -0.70710678]
 [ 0.70710678  0.70710678]]
In this output:
- The eigenvalues 333 and 111 indicate the amount of variance along their respective directions.
- The eigenvectors point to the directions of maximum variance in the dataset.
Summary of Eigenvectors and Eigenvalues
Here’s a quick overview to reinforce our understanding of eigenvectors and eigenvalues:
| Concept | Definition | Importance |
|---|---|---|
| Eigenvector | A vector that remains in the same direction after a matrix transformation. | Identifies directions of maximum variance. |
| Eigenvalue | A scalar that indicates how much the eigenvector is stretched or shrunk during the transformation. | Represents the variance along the eigenvector. |
Applications in Machine Learning: Eigenvalues and Eigenvectors
Eigenvalues and eigenvectors play a crucial role in several machine learning algorithms, particularly when dealing with large datasets. By understanding their significance, you can use their power to optimize your models and make them more efficient. This article will explore their applications in Principal Component Analysis (PCA), Spectral Clustering, and how they aid in dimensionality reduction.
When you study Linear Algebra for Data Science, eigenvalues and eigenvectors become more than just mathematical tools—they help you gain deeper insights into your data and enhance your computational efficiency.
Principal Component Analysis (PCA)
Principal Component Analysis (PCA) is a popular technique that relies on eigenvectors and eigenvalues. It’s commonly used for dimensionality reduction, which means reducing the number of features in a dataset while retaining as much important information as possible. PCA achieves this by identifying the directions (eigenvectors) that capture the most variance in the data and scaling them by their importance (eigenvalues).
How PCA Uses Eigenvectors and Eigenvalues
PCA identifies the directions, called principal components, where the data varies the most. These directions are represented by eigenvectors. The amount of variance in each direction is measured by the corresponding eigenvalues.
- Eigenvectors point to the directions that capture the most significant patterns in the data.
- Eigenvalues show how much of the data’s variance is captured in each of these directions.
Together, they help reduce the dataset to its most important features while preserving valuable information.
Example of PCA
Let’s consider a dataset with hundreds of features (columns). By applying PCA, we can reduce this number to a smaller set of principal components, which represent the majority of the variance in the data.
For instance, if your dataset has 100 features, after applying PCA, you might reduce it to just 10 or 15 components. This reduction improves the computational efficiency of machine learning algorithms, as the model will now work with fewer features while still retaining most of the important information.
Here’s an example using Python:
import numpy as np
from sklearn.decomposition import PCA
from sklearn.datasets import load_iris

# Load example dataset
data = load_iris()
X = data.data

# Applying PCA
pca = PCA(n_components=2)  # Reduce to 2 dimensions
X_reduced = pca.fit_transform(X)

print("Reduced dataset shape:", X_reduced.shape)
In this case, the dataset originally had 4 features. PCA reduced it to 2 components while preserving most of the variance. These components are the eigenvectors, and their corresponding eigenvalues tell us how much variance each component captures.
Spectral Clustering
Another key application of eigenvectors and eigenvalues in machine learning is spectral clustering. This method involves transforming data points into a different space where clusters are more apparent.
How Spectral Clustering Works
Spectral clustering uses the eigenvectors of a similarity matrix to group data into clusters. It works by transforming the data into a lower-dimensional space based on these eigenvectors. This transformation makes the structure of the clusters clearer, allowing the algorithm to easily identify natural groupings within the data.
Here’s the general process:
- A similarity matrix is constructed based on pairwise distances between data points.
- The eigenvectors of this matrix are calculated.
- The top k eigenvectors are selected, and the data points are projected onto this new space (just like in PCA).
- Finally, a clustering algorithm, such as k-means, is applied to these projections.
This method is particularly useful when the clusters are not easily separable using traditional clustering methods like k-means. Spectral clustering helps by finding clusters in a transformed space, revealing hidden patterns.
Dimensionality Reduction Using Eigenvectors
Dimensionality reduction is a key application of Linear Algebra for Data Science, and eigenvectors are at the heart of this process. Reducing the number of features is essential, especially when working with large datasets where computational efficiency becomes a concern.
Why Dimensionality Reduction?
- Computational Efficiency: Fewer features mean less time required for training the model.
- Avoiding Overfitting: Reducing dimensions can also help reduce the chances of overfitting, particularly in cases where the dataset has a high number of features compared to data points.
- Improved Visualization: In some cases, reducing dimensions to 2D or 3D helps in better understanding and visualizing the data.
Eigenvectors for Dimensionality Reduction
As mentioned earlier, in techniques like PCA, eigenvectors help identify the directions with the most variance in the data. By selecting the top eigenvectors (those linked to the largest eigenvalues), you can project the data into a lower-dimensional space.
Example: Imagine you have a dataset with 50 features. After applying PCA, you discover that 90% of the variance is captured by just 5 eigenvectors. This means you can reduce the dataset from 50 dimensions to just 5, retaining most of the important information without much loss.
Practical Example
Let’s walk through a practical Python example that uses eigenvectors to reduce dimensions with PCA:
from sklearn.datasets import load_digits
from sklearn.decomposition import PCA
import matplotlib.pyplot as plt

# Load dataset
digits = load_digits()
X = digits.data

# Apply PCA
pca = PCA(n_components=2)
X_pca = pca.fit_transform(X)

# Plot the reduced dataset
plt.scatter(X_pca[:, 0], X_pca[:, 1], c=digits.target)
plt.xlabel('Principal Component 1')
plt.ylabel('Principal Component 2')
plt.title('PCA - Reduced Dimensions')
plt.show()
This example reduces a 64-feature dataset to 2 dimensions using eigenvectors from PCA, allowing us to plot and visualize the data in 2D space.
Summary of Eigenvectors and Eigenvalues in Machine Learning
Here’s a quick summary of how eigenvectors and eigenvalues are used in machine learning:
| Application | Role of Eigenvectors and Eigenvalues |
|---|---|
| Principal Component Analysis (PCA) | Eigenvectors identify directions of maximum variance, eigenvalues quantify the variance. |
| Spectral Clustering | Eigenvectors are used to project data into a space where clusters are more separable. |
| Dimensionality Reduction | Eigenvectors reduce the number of features, improving computational efficiency. |
Eigenvectors and eigenvalues are not just abstract mathematical concepts—they are powerful tools in machine learning and data science. From PCA to spectral clustering, they enable us to simplify complex datasets, reduce dimensions, and find meaningful patterns.
Conclusion
In this first part of our exploration into linear algebra for data science, we’ve highlighted the foundational role it plays in manipulating data, building machine learning models, and powering real-world applications like recommendation systems and facial recognition. From understanding vectors and matrices to learning how to perform matrix operations like multiplication and transposition, linear algebra provides the mathematical backbone for transforming data and extracting insights.
Grasping these key concepts not only makes it easier to handle large datasets but also opens up pathways to implementing more complex algorithms. With tools like NumPy and TensorFlow heavily relying on linear algebra, having a solid understanding of these principles is crucial for any data scientist or machine learning practitioner.
In Part 2, we’ll delve deeper into advanced topics such as Singular Value Decomposition (SVD), tensors, and how these techniques apply to modern machine learning and AI systems. Stay tuned as we continue to explore the fascinating applications and techniques in linear algebra that help shape the future of data science.
FAQ
What is the role of vectors in data science?
Vectors are one-dimensional arrays used to represent features of data in machine learning. They serve as input feature vectors for models and help in making predictions by encoding information in a structured format.
How do matrices represent datasets?
Matrices are two-dimensional arrays where rows represent individual data points and columns represent features. This structure allows for efficient data manipulation and mathematical operations essential for machine learning algorithms.
Why is matrix multiplication important in machine learning?
Matrix multiplication is crucial because it allows for the transformation of data. It enables operations like linear regression, Principal Component Analysis (PCA), and neural network calculations, making it fundamental to many machine learning algorithms.
What are eigenvectors and eigenvalues, and why are they significant?
Eigenvectors and eigenvalues are mathematical concepts that help identify patterns in data. They are essential in techniques like PCA for dimensionality reduction, allowing data scientists to simplify datasets while retaining important information.
External Resources
Linear Algebra for Data Science
- Resource: Khan Academy – Linear Algebra
- Description: A comprehensive online course covering the fundamental concepts of linear algebra, including vectors, matrices, and their applications in various fields.
Understanding Vectors and Matrices in Python
- Resource: NumPy Documentation
- Description: The official NumPy documentation provides a thorough introduction to using arrays and matrices in Python, essential for data manipulation in data science.
Principal Component Analysis (PCA)
- Resource: Scikit-learn Documentation – PCA
- Description: An official guide on how to implement PCA using Scikit-learn, including examples and explanations of its use in dimensionality reduction.

![Linear Algebra for Data Science: The Complete Guide [Part 1] Linear Algebra for Data Science: The Complete Guide [Part 1]](https://emitechlogic.com/wp-content/uploads/2024/10/Linear-Algebra-for-Data-Science.webp)






Leave a Reply