

Python Execution Flow: What Happens When You Hit ‘Run’?
Introduction
Python execution flow: Ever wonder what really happens when you run a Python script? You write some code, hit Run, and—boom—it works (or throws an error). But behind the scenes, Python goes through a whole process to make that happen.
In this post, I’ll walk you through Python’s execution step by step. You’ll see how Python reads your code, runs it, handles variables and functions, and why some errors only show up when you actually run the script.
By the end, you’ll understand what’s going on behind the scenes, so you can debug problems faster and write better code.
Understanding Python Execution Flow

When you run a Python script, a lot happens behind the scenes. Unlike compiled languages like C or Java, Python interprets your code line by line instead of converting everything into machine code beforehand.
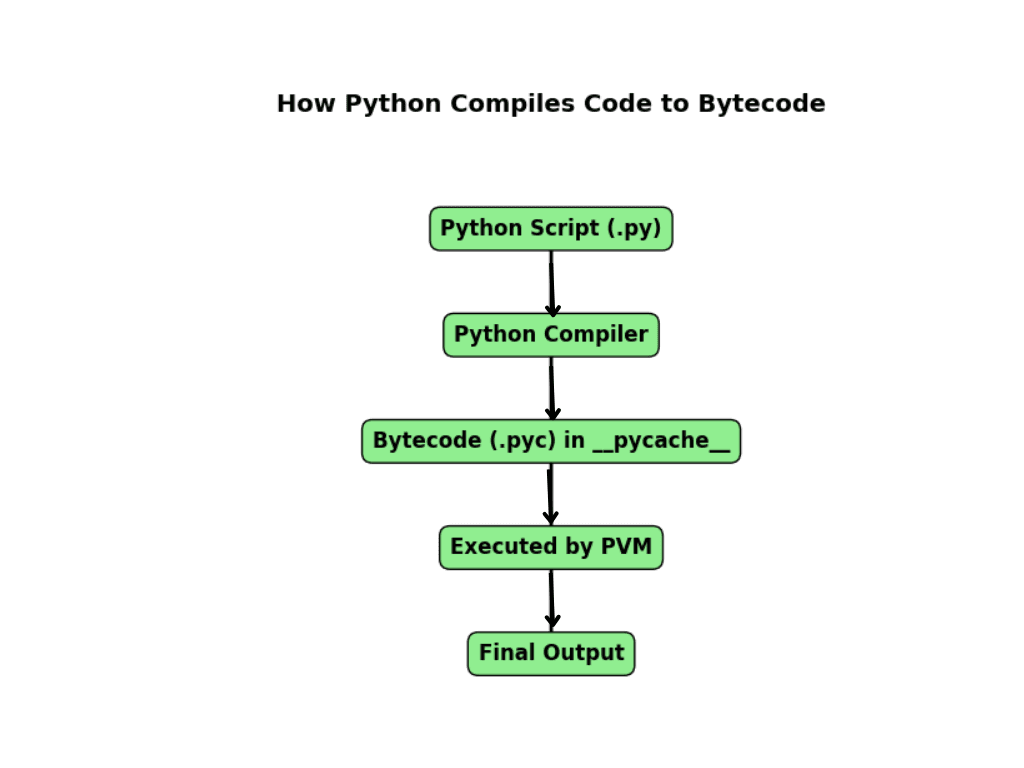
This process involves three key steps:
- Parsing and Lexical Analysis – Python reads and breaks down your code.
- Compilation to Bytecode – Your code is converted into bytecode.
- Execution by the Python Virtual Machine (PVM) – The PVM runs the bytecode to get the final output.
Understanding this flow helps you write better code, optimize performance, and debug errors effectively.
Step 1: Parsing and Lexical Analysis
The first thing Python does is read your code and break it into small parts. This process is called lexical analysis, and it happens before your script even starts running.
How Python Reads and Tokenizes Your Code
Python scans your script character by character and groups them into meaningful units called tokens. Tokens include keywords, variables, numbers, and symbols like +, =, and ().
For example, take this simple Python code:
x = 5 + 3
print(x)
Python breaks this into tokens:
x→ Variable name=→ Assignment operator5and3→ Numbers+→ Addition operatorprint→ Function name
Introduction to the AST (Abstract Syntax Tree)
Once tokenized, Python organizes the tokens into a tree structure called the Abstract Syntax Tree (AST). This tree helps Python understand the structure of your program.
You can see the AST representation of your code using Python’s ast module:
import ast
code = "x = 5 + 3"
tree = ast.parse(code)
print(ast.dump(tree, indent=4))

This shows us a structured breakdown of how Python interprets your code before running it.
Step 2: Compilation to Bytecode
After parsing, Python doesn’t run your code immediately. Instead, it converts it into bytecode—a low-level, optimized version of your script.
What is Bytecode and Why is it Important?
Bytecode is a set of instructions that Python’s Virtual Machine can understand. Instead of directly running your source code, Python executes this intermediate format, which speeds things up.
Where is Bytecode Stored?
Python saves compiled bytecode files in a folder called __pycache__ with a .pyc extension. If you run a script named example.py, Python creates:
__pycache__/example.cpython-XYZ.pyc
Here, XYZ is the Python version used (e.g., 311 for Python 3.11).
Disassembling Bytecode with the dis Module
Python’s dis module allows you to see what the bytecode looks like. Try this:
import dis
def add_numbers():
    x = 5 + 3
    return x

dis.dis(add_numbers)

This prints low-level instructions that Python executes. Understanding bytecode can help with debugging and performance optimization.
Step 3: Execution by the Python Virtual Machine (PVM)

Now that we have bytecode, Python needs a way to run it. This is where the Python Virtual Machine (PVM) comes in.
What is the Python Virtual Machine (PVM)?
The PVM is a part of the Python interpreter that reads bytecode and runs it step by step. It does not convert bytecode into machine code but interprets it directly, making Python an interpreted language.
Different Python Implementations
While most people use CPython (the standard Python implementation), there are other versions that handle execution differently:
- CPython → The most common version, written in C.
- PyPy → A faster alternative with a Just-In-Time (JIT) compiler.
- Jython → Runs Python code on the Java Virtual Machine (JVM).
- IronPython → Runs Python on Microsoft’s .NET framework.
Each of these affects execution speed, memory usage, and compatibility with other programming languages.
Python Execution Flow in Detail
Now that we’ve covered how Python reads and compiles code, let’s go deeper into how execution works. Python doesn’t just run your script in one go; it follows a structured execution process, handling memory, managing execution threads, and optimizing performance where possible.
How the Python Interpreter Works
Python provides two ways to execute your code:
- Interactive Mode (REPL – Read-Eval-Print Loop)
- When you type Python commands in the terminal (e.g.,
pythonorpython3), Python enters interactive mode. - Every command you type is read (Read), evaluated (Eval), executed (Print), and then waits for the next input (Loop).
- This is useful for testing small pieces of code.
- When you type Python commands in the terminal (e.g.,
- Running a
.pyFile (Script Mode)- When you write a script in a
.pyfile and run it (python script.py), Python loads the entire file and executes it. - It follows the parsing → compilation → execution process we discussed earlier.
- When you write a script in a
Key difference: In interactive mode, Python executes each line immediately, while in script mode, Python first compiles everything to bytecode and then runs it.
The Role of Python Memory Management
Python’s memory management. You probably don’t spend much time thinking about it, but every time you create a variable or an object, Python quietly finds a place for it in memory. And when you’re done using it, Python tries to clean it up to free space.
Sounds simple, right? Well, mostly. But there’s a bit more going on behind the scenes.
How Python Keeps Track of Memory
Python has two main ways of handling memory:
- Reference Counting – the basic system that tracks how many things are using an object.
- Garbage Collection (GC) – a backup system that cleans up when reference counting isn’t enough.
Let’s break these down:
Reference Counting: The Basics
Every object in Python keeps a count of how many variables are pointing to it.
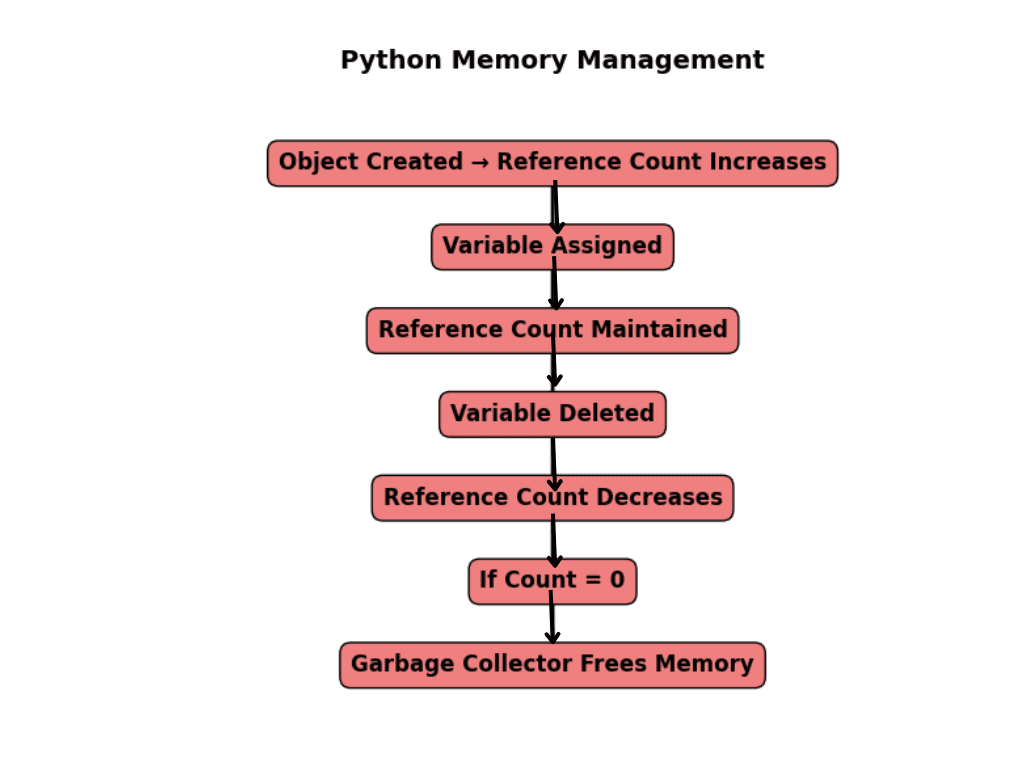
- When you create an object, its reference count starts at 1.
- If you assign it to another variable, the count goes up.
- When a variable stops using it, the count goes down.
- Once the count hits 0, Python deletes the object and frees the memory.
Here’s a quick example:
import sys

x = [1, 2, 3]  # Create a list
print(sys.getrefcount(x))  # Check how many references exist
Now, here’s something weird—this will actually print 2, not 1. Why?
Because Python temporarily adds an extra reference when you pass x to sys.getrefcount(x). So in reality, x only had one reference, but the function call momentarily increases it.
But What If Objects Point to Each Other? (The Circular Reference Problem)
Okay, reference counting works most of the time, but there’s a problem…
Let’s say two objects reference each other. Their reference counts never hit zero, so Python never deletes them. That’s called a circular reference.
Here’s an example:
class Node:
    def __init__(self):
        self.next = self  # Self-referencing object

n = Node()
del n  # You'd think this deletes it, but nope—it’s still in memory!
Even though we deleted n, the object is still stuck in memory. Why? Because it’s pointing to itself, so its reference count never reaches zero.
How Python Fixes This: Garbage Collection (GC)
Python has a built-in garbage collector (GC) that finds and removes circular references. Think of it as a little cleanup crew that runs in the background, looking for objects that should be deleted but aren’t.
You can even manually trigger garbage collection like this:
import gc
gc.collect()  # Force Python to clean up memory
This tells Python, “Hey, stop what you’re doing and clean up any junk you find.”
Does Python’s Memory Management Slow Things Down?
Yes, sometimes.
Garbage collection is great, but it runs in the background, and when it does, your program might slow down for a moment.
That’s why some developers turn it off when performance is critical:
import gc
gc.disable()  # Turn off garbage collection
# Run some high-performance code...
gc.enable()  # Turn it back on
Would you actually need to do this? Probably not, unless you’re working with huge datasets or real-time applications that can’t afford delays.
What You Should Take Away from This
- Python automatically manages memory, but understanding how it works can help you write better code.
- Reference counting keeps track of objects, but it fails when objects point to each other.
- Garbage collection fixes this, but it can slow things down when it runs.
- If your program is using a ton of memory, you can manually trigger or disable garbage collection to optimize performance.
So, next time you run a Python program, just remember—there’s a whole memory management system working behind the scenes to keep everything running smoothly!
Global Interpreter Lock (GIL) and Its Impact on Python execution
What is the GIL?
So, you’ve probably heard that multithreading can speed up programs, right? Well… not exactly in Python.
Python has a special lock called the Global Interpreter Lock (GIL). This lock forces Python to run only one thread at a time, no matter how many CPU cores you have.
Why does Python have the GIL?
Python manages memory using reference counting (remember, it keeps track of how many variables use an object). But this system isn’t thread-safe—if multiple threads change an object’s reference count at the same time, things could break.
To prevent memory corruption, Python locks the interpreter so that only one thread can execute Python code at a time.
This means:
- No true parallel execution in Python threads (at least in CPython, the default Python implementation).
- It prevents race conditions, but limits performance for CPU-heavy tasks.
How the GIL Affects Multithreading
Let’s say you write a multithreaded program, expecting it to run faster. But because of the GIL, Python only allows one thread to execute at a time—even if you have a powerful multi-core processor.
Here’s an example:
import threading

def task():
    for _ in range(1000000):
        pass  # Simulating a CPU-heavy task

threads = [threading.Thread(target=task) for _ in range(4)]

for t in threads:
    t.start()

for t in threads:
    t.join()
What happens here?
- We create 4 threads and start them.
- Each thread runs the same function, looping 1 million times.
- You’d expect it to be 4x faster, right? Wrong.
- Because of the GIL, only one thread executes at a time, making this almost as slow as running a single thread.
So, for CPU-bound tasks (tasks that use a lot of processing power), multithreading doesn’t help in Python.
Bypassing the GIL Using Multiprocessing
Okay, so threads don’t help much. But what if we could run separate Python processes instead?
Unlike threads, processes don’t share memory. Each process gets its own interpreter and memory space, meaning they don’t have to follow the GIL rules.
Here’s how you can use multiprocessing instead of multithreading:
import multiprocessing

def task():
    for _ in range(1000000):
        pass  # Simulating a CPU-heavy task

processes = [multiprocessing.Process(target=task) for _ in range(4)]

for p in processes:
    p.start()

for p in processes:
    p.join()
What’s different here?
- Instead of threads, we’re using processes.
- Each process runs independently, so they can all execute at the same time, fully using multiple CPU cores.
- No GIL restriction—this actually speeds up execution.
So, if you need real parallel execution in Python, use multiprocessing instead of multithreading.
Does the GIL Affect All Python Implementations?
Nope! The GIL is only a problem in CPython (the standard Python most people use).
If you’re working on a project that needs real multithreading, you might want to use a different Python implementation:
- Jython → Python running on Java’s JVM, which doesn’t have a GIL.
- IronPython → Python for .NET (also no GIL).
- PyPy → Uses a Just-In-Time (JIT) compiler, which speeds up execution and sometimes reduces the impact of the GIL.
If performance and parallel execution are important, switching from CPython to PyPy or Jython might be worth considering.
Key Takeaways
- The GIL locks Python’s execution to one thread at a time, even if you have multiple CPU cores.
- Multithreading doesn’t speed up CPU-heavy tasks because of the GIL.
- Use multiprocessing instead of threading if you need true parallel execution.
- The GIL only exists in CPython—other Python versions like Jython, IronPython, and PyPy don’t have this issue.
So next time you’re writing a program and wondering why multithreading isn’t making it faster, blame the GIL!
Must Read
- Why sorted() Is Safer Than list.sort() in Production Python Systems
- Monotonic Sequence in Python: 7 Practical Methods With Edge Cases, Interview Tips, and Performance Analysis
- How to Check if Dictionary Values Are Sorted in Python
- Check If a Tuple Is Sorted in Python — 5 Methods Explained
- How to Check If a List Is Sorted in Python (Without Using sort()) – 5 Efficient Methods
Optimizing Python Execution
Python is easy to write, but sometimes it runs slower than expected. The good news? There are ways to speed it up!
How to Optimize Python Execution Speed
Python isn’t the fastest language because it’s interpreted (it runs code line by line instead of compiling it all at once). But you can make it run faster by:
- Using efficient data structures (e.g.,
setinstead oflistfor lookups). - Avoiding unnecessary loops (use list comprehensions or built-in functions).
- Using built-in functions (they’re optimized in C).
- Minimizing global variable usage (local variables are faster).
- Using JIT compilation with PyPy (explained next!).
Using JIT Compilation (Just-In-Time) with PyPy
Ever wish Python ran as fast as C or Java? Well, that’s where PyPy comes in!
PyPy is an alternative Python implementation that includes JIT compilation.
What is JIT (Just-In-Time) Compilation?
Normally, Python interprets code line by line. JIT compilation translates frequently used code into machine code on the fly, making execution much faster.
💡 Think of it like this:
- Regular Python (CPython) → Reads code line by line every time.
- PyPy with JIT → Notices repeated code, compiles it into fast machine code, and reuses it.
How much faster is PyPy?
PyPy can be up to 4–10x faster than regular Python, especially for long-running programs.
How to use PyPy?
Simple! Just install PyPy and run your script like this:
pypy my_script.py
That’s it! Your Python program now runs much faster without changing any code.
Best Practices for Efficient Python Execution
Want your Python programs to run smoothly? Follow these best practices:
- Use built-in functions
- Instead of loops:
sum(my_list) # Faster than looping through elements
2. Avoid unnecessary computations
- Instead of recalculating inside a loop:
result = expensive_function()
for _ in range(1000):
    use_result(result)  # Store and reuse instead of recalculating
3. Use list comprehensions
- Instead of:
new_list = []
for x in old_list:
    new_list.append(x * 2)
- Use:
new_list = [x * 2 for x in old_list] # Faster!
4. Use the right data structure
- Lists (
[]) → Good for ordered data - Tuples (
()) → Faster than lists (if data won’t change) - Sets (
{}) → Great for fast lookups - Dictionaries (
{key: value}) → Fast key-value access
5. Profile your code (explained next!)
Tools to Analyze Python Execution Flow
Before optimizing, you need to find the slow parts of your code. Here are 3 powerful tools to help:
1. dis module for Bytecode Analysis
The dis module lets you see what Python does behind the scenes.
Example:
import dis

def add_numbers(a, b):
    return a + b

dis.dis(add_numbers)
Output:
  2           0 LOAD_FAST                0 (a)
              2 LOAD_FAST                1 (b)
              4 BINARY_ADD
              6 RETURN_VALUE
What does this mean?
LOAD_FAST→ Loadsaandbinto memory.BINARY_ADD→ Adds them.RETURN_VALUE→ Returns the result.
If your function has too many operations, you might optimize it by simplifying logic.
2. timeit for Measuring Execution Time
Want to know exactly how long your code takes to run? Use timeit.
Example:
import timeit

setup_code = "my_list = [x for x in range(1000)]"
test_code = "sum(my_list)"

execution_time = timeit.timeit(test_code, setup=setup_code, number=10000)
print(f"Execution time: {execution_time:.5f} seconds")
Why use timeit?
- More accurate than
time.time()because it runs the code multiple times and takes an average. - Helps you compare different approaches to see which is faster.
3. cProfile for Profiling Python Programs
If your program is too slow, you need to find the bottlenecks. cProfile helps by showing which functions take the most time.
Example:
import cProfile

def slow_function():
    total = 0
    for i in range(1000000):
        total += i
    return total

cProfile.run("slow_function()")
What happens here?
cProfileruns the function and shows detailed stats:- How many times each function runs
- Total execution time
- Time per function call
If a function takes too long, you know where to optimize!
Key Takeaways
- Python is slow because it’s interpreted, but you can optimize it.
- PyPy + JIT can make Python 4–10x faster with no code changes.
- Best practices like using built-in functions, avoiding unnecessary loops, and picking the right data structures improve execution speed.
- Use analysis tools to find slow parts of your code:
dis→ See how Python executes your code.timeit→ Measure how long code takes.cProfile→ Find slow functions.
By following these tips, you’ll write faster and more efficient Python programs!
Common Python Execution Flow Errors and Debugging
Even the best Python programmers run into errors sometimes. The key to writing better code is knowing what these errors mean and how to fix them quickly.
Let’s go over some common Python errors and the best debugging tools to solve them.
SyntaxErrors, IndentationErrors, and RuntimeErrors Explained
Errors in Python usually fall into three categories:
1. SyntaxErrors – “Python doesn’t understand the code”
A SyntaxError happens when Python doesn’t understand what you wrote because it breaks the language rules.
Example:
print("Hello" # Missing closing parenthesis
Error:
SyntaxError: unexpected EOF while parsing
Fix:
Make sure all parentheses, brackets, and colons are correctly placed.
Another Example:
if x = 5:  # Wrong! Use '==' for comparison, not '='
    print("x is 5")
Error:
SyntaxError: invalid syntax
Fix:
Use double equals (==) for comparison:
if x == 5:
    print("x is 5")
2. IndentationErrors – “The code is not aligned properly”
Python relies on indentation (spaces or tabs) to structure the code. If the indentation is wrong, Python won’t run it.
Example:
def greet():
print("Hello")  # Oops! Needs indentation
Error:
IndentationError: expected an indented block
Fix:
def greet():
    print("Hello")  # Indented correctly
Another Example – Mixing Spaces and Tabs
def greet():
    print("Hello")
	print("How are you?")  # Uses a tab instead of spaces
Error:
IndentationError: unindent does not match any outer indentation level
Fix:
Use only spaces or only tabs, but never mix them. Most Python code uses 4 spaces per indentation.
3. RuntimeErrors – “The code is correct, but something went wrong when running it”
A RuntimeError happens when the syntax is correct, but something unexpected happens during execution.
Example – Division by Zero
x = 10 / 0 # Can't divide by zero!
Error:
ZeroDivisionError: division by zero
Fix:
Check if the denominator is zero before dividing:
def safe_divide(a, b):
    if b == 0:
        return "Cannot divide by zero"
    return a / b
Example – Using a Variable Before Defining It
print(age) # We never defined 'age'
Error:
NameError: name 'age' is not defined
Fix:
Make sure the variable is defined before using it:
age = 25
print(age)  # Works fine
Debugging Tools: Finding and Fixing Errors
Now that we know common errors, let’s look at 3 powerful debugging tools that can help find and fix them faster.
1. pdb (Python Debugger) – Step Through Your Code
The pdb module lets you pause your program and check variables step by step. This is super useful for finding where things go wrong.
How to Use pdb?
Example – Debugging a Function
import pdb

def divide(a, b):
    pdb.set_trace()  # Pause execution here
    return a / b

print(divide(10, 0))  # Oops! This will cause an error
What happens?
When the program reaches pdb.set_trace(), it pauses and lets you inspect variables. You can type:
p→ Print a variable (p a,p b)c→ Continue executionq→ Quit debugging
This helps you see what’s wrong before the program crashes.
2. logging Module – Track What Happens in Your Code
If you don’t want to pause the program but still track what’s happening, use the logging module.
Why Use logging Instead of print()?
print()works, but removing all prints later is annoying.loggingrecords messages without cluttering code.- You can save logs to a file for later debugging.
Example – Using logging for Debugging
import logging

logging.basicConfig(level=logging.DEBUG)

def divide(a, b):
    if b == 0:
        logging.error("Attempted to divide by zero")
        return None
    return a / b

print(divide(10, 0))  # This will log an error
Output (with logging enabled):
ERROR:root:Attempted to divide by zero
This helps track errors without stopping the program!
3. trace Module – See What Your Code is Doing Line by Line
The trace module helps see every line of code that runs.
Example – Tracing a Function Call
import trace

def greet():
    print("Hello")
    print("How are you?")

tracer = trace.Trace(count=True, trace=True)
tracer.run('greet()')
Output:
 --- modulename: script.py, function: greet
 script.py(3): print("Hello")
Hello
 script.py(4): print("How are you?")
How are you?
This helps you track exactly what happens step by step.
Key Takeaways
- Know common Python errors:
- SyntaxErrors → Fix syntax mistakes.
- IndentationErrors → Use correct indentation.
- RuntimeErrors → Handle errors like division by zero.
- Use debugging tools to find errors faster:
pdb→ Pause execution and check variables.logging→ Track events without stopping the program.trace→ See every line of execution.
By mastering these tools, you’ll become a Python debugging pro!
Conclusion: Python Execution Flow in Action
When you hit “Run”, Python follows a structured path—parsing, compiling, and executing your code while managing memory and handling errors. By understanding this process, you can write faster, more efficient programs and avoid common pitfalls.
To improve execution speed, consider JIT compilation (PyPy), optimize memory usage, and use profiling tools like cProfile. If your workload demands true parallelism, multiprocessing can bypass Python’s Global Interpreter Lock (GIL).
Mastering Python’s execution flow gives you better control over performance, debugging, and optimization. Keep exploring tools and techniques to refine your coding skills and build high-performance applications.
FAQs on Python execution
1. What happens when I run a Python script?
2. Why does Python use a Global Interpreter Lock (GIL)?
3. How can I optimize Python execution speed?
cProfile and timeit.4. What tools can help debug Python execution errors?
pdb (Python Debugger) for step-by-step code execution
logging module to track program flow and errors
trace module to analyze function calls and execution steps
Got more questions? Visit EmitechLogic for deeper insights!
External Resources
If you want to explore Python execution flow in more detail, here are some great resources:
Official Python Documentation – Learn about the Python execution model, bytecode, and memory management.
https://docs.python.org/3/reference/executionmodel.html
Python’s GIL Explained – A deep dive into how the Global Interpreter Lock affects performance.
https://realpython.com/python-gil/


) – 5 Efficient Methods")
Leave a Reply