Posted inBlog Data Science & Projects
How to Use NumPy, Pandas, and Matplotlib for Data Analysis
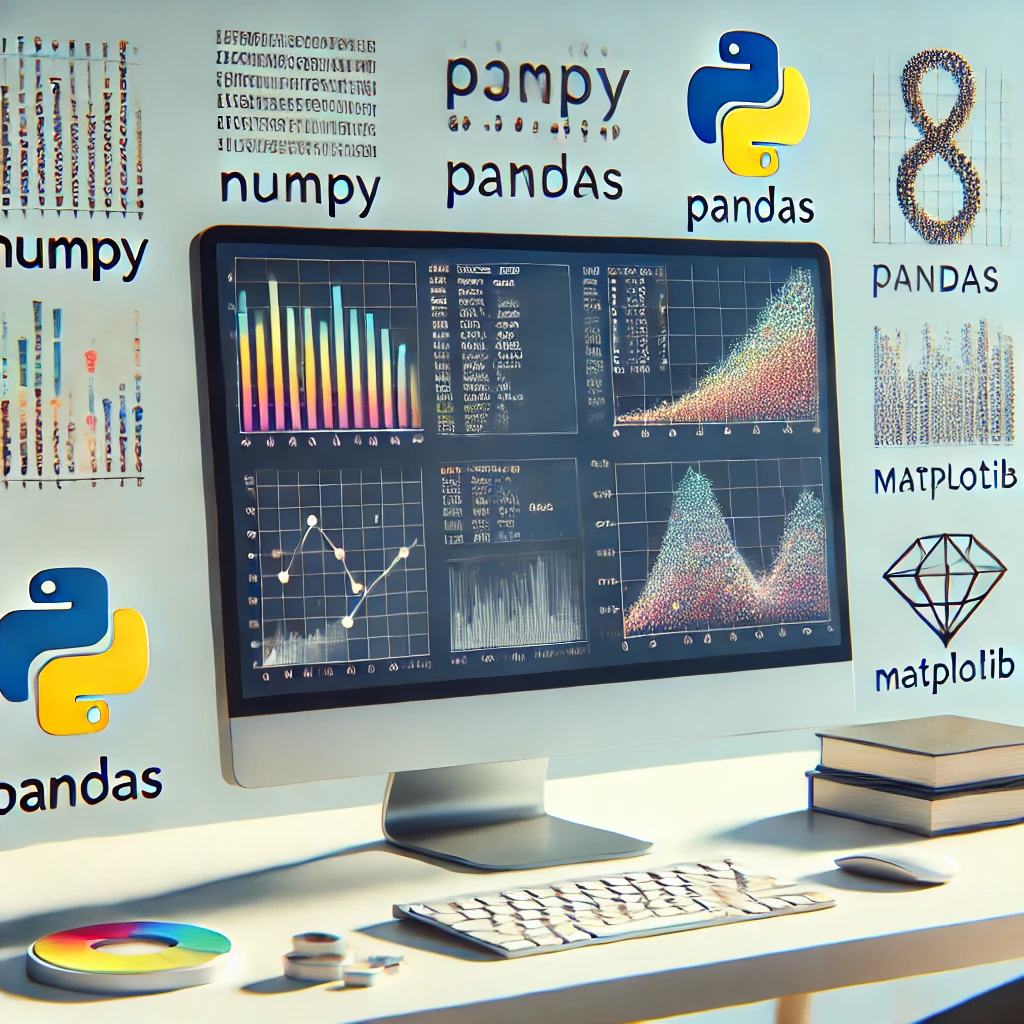
If you're working with data in Python, you’ve likely heard of NumPy, Pandas, and Matplotlib. These three libraries are essential for data analysis and visualization. But knowing where to start can feel confusing. Each of these tools offers powerful features that simplify your work, whether it’s cleaning data, running calculations, or creating graphs.
In this guide, I’ll show you how to use NumPy for numerical tasks, Pandas for organizing data, and Matplotlib to create charts and visual reports. By the end, you’ll see how they all work together to help you with your data analysis projects.
Using Python for data analysis is about working efficiently. These libraries make that possible. I’ll keep things simple and practical so you can start using them right away. Let’s get started and turn your data into valuable insights!