
Top Data Science Skills You Must Master in 2025

Top Data Science Skills You Must Master in 2025

In the ever-evolving world of data science, programming skills are the backbone of success. As we approach 2025, mastering Python and R continues to be important for data scientists. These languages have shaped how we analyze data, create visualizations, and build predictive models. While new languages are emerging, Python and R remain the foundation of most data science workflows. Let’s explore why these languages are irreplaceable, what new languages are gaining attention, and how you can stay ahead with the right data science skills.
How to Automating Data Cleaning with PyCaret

How to Automating Data Cleaning with PyCaret

Data cleaning is the process of identifying and fixing issues in a dataset to ensure it's accurate, consistent, and ready for analysis or modeling. This includes removing duplicates, handling missing values, correcting errors, and transforming data into a suitable format for machine learning. It’s like preparing ingredients before cooking—they need to be fresh and sorted before creating something amazing.
What is Data Wrangling in Data Science? An Ultimate Guide

What is Data Wrangling in Data Science? An Ultimate Guide

Data wrangling, in simple terms, is the process of preparing messy or raw data into a clean and organized format that can be used for analysis. It involves tasks like fixing errors, filling in missing values, removing duplicates, and transforming data into a consistent structure. Here’s an example to make it clear: If you receive a spreadsheet with inconsistent dates, missing information, or incorrect labels, data wrangling is the step where you clean it up so it’s accurate and ready to work with.
How to create PostgreSQL database in Django

How to create PostgreSQL database in Django

Have you been thinking about adding a PostgreSQL database to your Django project but aren’t sure where to start? Don’t worry—you’re not alone! Setting up a database might sound complex, but with a little guidance, it’s much easier than it seems. This guide is here to walk you through it step-by-step. So, why go with PostgreSQL? It’s fast, reliable, and trusted by developers around the world, from small projects to major applications. With PostgreSQL connected to your Django project, you’ll be able to handle data more effectively, scale as your app grows, and enjoy more flexibility for future features. We’ll cover everything you need, from the initial setup to writing your first database queries. By the end, you’ll have a working PostgreSQL database linked up to your Django project—and, even better, you’ll understand exactly how it all fits together. Ready to get started?
Confidence Interval in Data Science: A Complete Guide

Confidence Interval in Data Science: A Complete Guide

Have you ever looked at a prediction and wondered how accurate it really is? Confidence interval can help answer that. In data science, we rely on them to show how close our predictions might be to the true values. Think of it as a way to put a “range” around our results—so we don’t just get a single number but also an idea of how reliable that number is. Confidence intervals make our data analysis more trustworthy. Instead of guessing, they help us say, “We’re pretty sure the real value is somewhere in this range.” This concept might sound complex, but it’s really just a way to feel more confident in our findings, even when we’re only looking at a sample of data. In this post, we’ll take you through confidence intervals step by step, using everyday examples. You’ll learn how they work, and how they can improve the quality of your insights. So, if you want to boost your understanding of data analysis, keep reading! Confidence intervals may become one of your favorite tools.
Hypothesis testing for data scientists | by Emmimal Alexander

Hypothesis testing for data scientists | by Emmimal Alexander

If you're stepping into the world of data science, you've probably come across the term "hypothesis testing." But what does it really mean? Why should you care about it? Well, let me break it down for you in simple terms. Hypothesis testing is like a detective's toolkit for data scientists. It helps us figure out whether our ideas about data hold up or if we need to rethink them. Whether you’re analyzing trends in customer behavior or measuring the effectiveness of a new marketing campaign, hypothesis testing can guide your decisions and provide insights based on actual data. In this blog post, we’ll explore the ins and outs of hypothesis testing. We’ll look at what hypotheses are, how to formulate them, and the different methods we use to test them. By the end, you’ll not only understand the key concepts but also feel more confident in applying them to your projects. So, if you want to sharpen your data science skills and make your analyses more strong, keep reading! Let’s dive into the world of hypothesis testing together.
Bayes Theorem in Data Science: A Complete Guide

Bayes Theorem in Data Science: A Complete Guide

Imagine you have some information, but not all of it, and need to make a decision. For example, you might want to estimate the chance of rain based on yesterday's weather, or evaluate the accuracy of a medical test result. This is where Bayes Theorem comes in. Bayes' Theorem lets you update probabilities as new information becomes available. In simple terms, it helps calculate the chance of one event happening given that another has already occurred. It’s a powerful tool across fields like data science, machine learning, medical diagnosis, and even spam filtering. In this blog, we’ll guide you through Bayes' Theorem with easy examples and a simple formula to make everything clear. We’ll cover why sample space matters, and how to understand posterior probability. By the end, you’ll see how Bayes' Theorem turns data into insights and why it’s essential in data science and machine learning. Let’s dive in—you’ll be amazed at what Bayes' can reveal!
Gamma Distribution in Data Science: A Practical Approach with Python

Gamma Distribution in Data Science: A Practical Approach with Python

Have you ever wondered how data scientists make sense of unpredictable events? Or how they model things like waiting times, customer demand, or rainfall? Gamma Distribution is a tool that helps answer these questions, especially when patterns are unclear. In this blog post, we’ll break down Gamma Distribution in simple terms. You don’t need to be a statistics expert to follow along. We’ll go over what the Gamma Distribution is and why it’s so valuable. This concept is especially useful for time-based or count-based data. If you're ready to explore a method that can boost your data analysis skills, keep reading! By the end, you'll know how to apply Gamma Distribution in real-world projects. This will give you an edge in handling complex datasets with confidence.
Probability Distribution in Data Science

Probability Distribution in Data Science

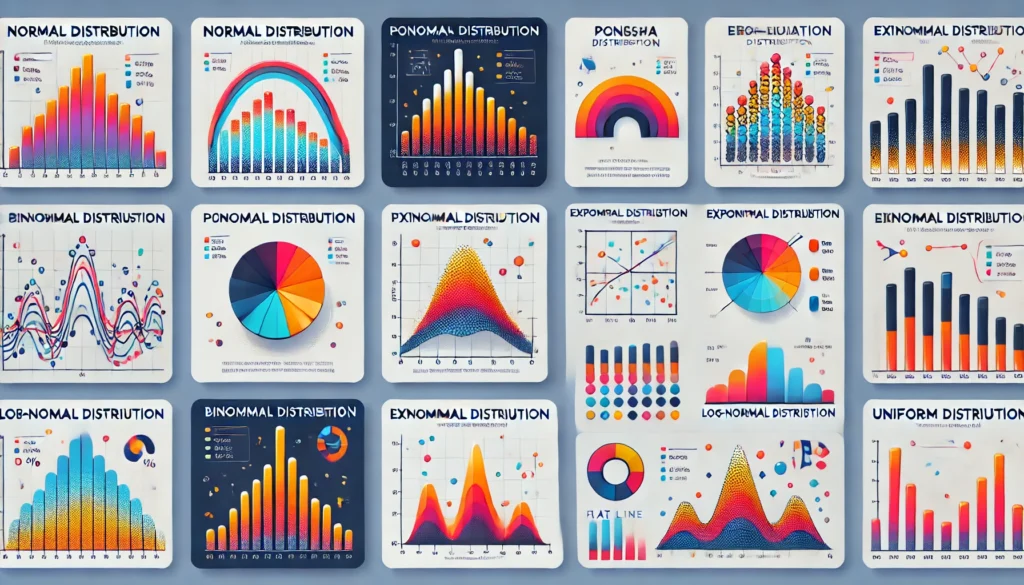
Have you ever noticed that certain things seem to happen more often than others? Like, you might see sunny days more often than snowy ones, or get more A’s and B’s than F’s on your report card. Probability distribution is a way to show where things tend to happen the most and where they don’t. Think of it like this: imagine we counted how many times each grade showed up on your report card. A probability distribution would help us see which grades you got most often and which ones were rare. This idea is super useful in data science because it helps us understand all kinds of patterns in data. In this blog, we’ll explore how probability distributions work. We’ll look at different types, like the normal distribution (which often looks like a hill) and others with different shapes. By the end, you’ll see how knowing about probability makes it easier to predict things and make smarter choices with data. Let’s get started and discover the world of probability together!
Understanding Random Variables in Data Science

Understanding Random Variables in Data Science

Random variables. That sounds a bit technical, right? But actually, these little guys are everywhere in data science. They are quietly working behind the scenes to help us make sense of all the randomness in life. Imagine you’re trying to figure out how likely a customer is to buy a product or how a stock might move tomorrow. There’s uncertainty in both, right? Random variables help us put a number on that uncertainty, making it possible to turn unpredictable data into real insights. In this post, we’ll take a closer look at what random variables are, why they’re so important in data science, and how they help us understand and even use the randomness around us. Don’t worry – no heavy math, just a friendly walk-through of how these “random” variables make data science tick. Ready to get curious? Let’s explore and discover how randomness can be useful!